- Graph points on a coordinate plane
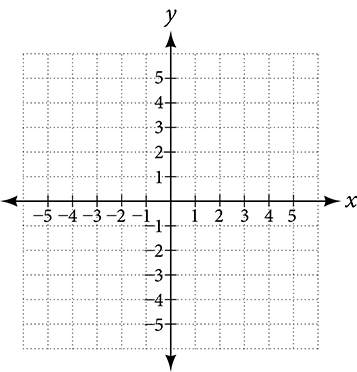
The Cartesian coordinate system, also called the rectangular coordinate system, is based on a two-dimensional plane consisting of the x-axis and the y-axis.
Perpendicular to each other, the axes divide the plane into four sections. Each section is called a quadrant; the quadrants are numbered counterclockwise as shown in the figure below.
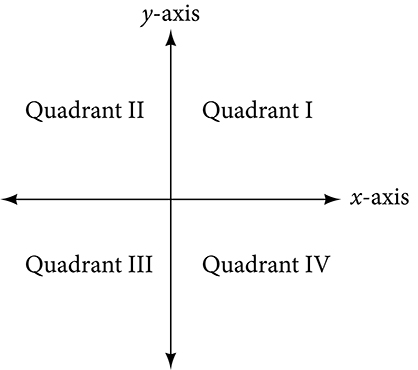
The center of the plane is the point at which the two axes cross. It is known as the origin or point [latex]\left(0,0\right)[/latex]. From the origin, each axis is further divided into equal units: increasing, positive numbers to the right on the x-axis and up the y-axis; decreasing, negative numbers to the left on the x-axis and down the y-axis. The axes extend to positive and negative infinity as shown by the arrowheads in the figure below.
Cartesian coordinate system
A two-dimensional plane where the
- [latex]x[/latex]-axis is the horizontal axis
- [latex]y[/latex]-axis is the vertical axis
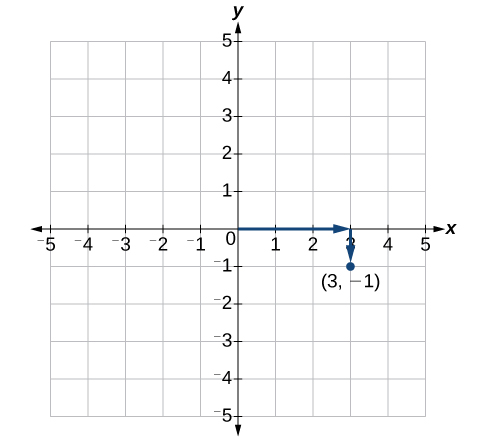
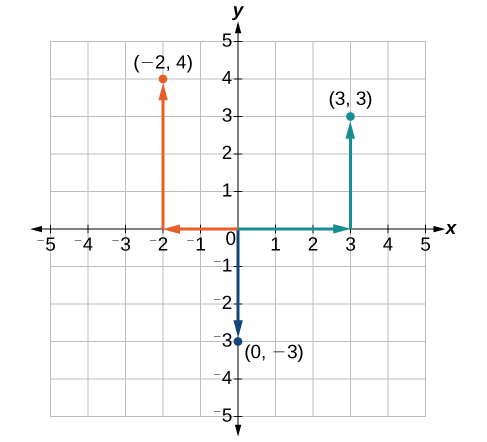
A point in the plane is defined as an ordered pair, [latex](x,y)[/latex], such that [latex]x[/latex] is determined by its horizontal distance from the origin and [latex]y[/latex] is determined by its vertical distance from the origin.
Plotting Points
Each point in the plane is identified by its x-coordinate, or horizontal displacement from the origin, and its y-coordinate, or vertical displacement from the origin. Together we write them as an ordered pair indicating the combined distance from the origin in the form [latex]\left(x,y\right)[/latex].