Identifying Vertical Shifts
One simple kind of transformation involves shifting the entire graph of a function up and down, known as a vertical shift.
vertical shift
A vertical shift occurs when you add or subtract a constant value to the function [latex]f(x)[/latex].
This shifts the graph of the function vertically without changing its shape.
- Upward shift: If you add a constant [latex]c[/latex] to the function [latex]f(x)[/latex], the graph of the function shifts upward by [latex]c[/latex] units.
[latex]g(x) = f(x) +c[/latex]
- Downward shift: If you subtract a constant [latex]c[/latex] to the function [latex]f(x)[/latex], the graph of the function shifts downward by [latex]c[/latex] units.
[latex]h(x) = f(x) -c[/latex]
 Original Function [latex]f(x)[/latex]
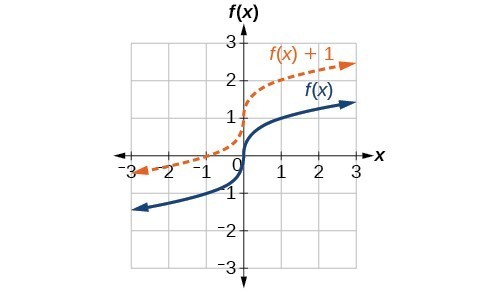
- The solid blue curve represents the original function [latex]\sqrt[3]{x}[/latex].
- The function [latex]f(x)[/latex] passes through the origin [latex](0,0)[/latex] because [latex]\sqrt[3]{0} = 0[/latex].
Vertically Shifted Function [latex]f(x) + 1[/latex]
- The dashed orange curve represents the function [latex]f(x) + 1 = \sqrt[3]{x} + 1[/latex].
- Each point on the graph of [latex]f(x) + 1[/latex] is exactly [latex]1[/latex] unit higher than the corresponding point on the graph of [latex]f(x)[/latex].
- For example:
- If [latex]x=0[/latex], then [latex]\sqrt[3]{0} +1 = 0 + 1 = 1[/latex].
- If [latex]x=1[/latex], then [latex]\sqrt[3]{1} +1 = 1 + 1 = 2[/latex].
A vertical shift involves moving the graph of a function up or down without altering its shape. In this case, adding [latex]1[/latex] to the function [latex]f(x) = \sqrt[3]{x}[/latex] results in a vertical shift of the graph upward by [latex]1[/latex] unit.
How To: Given a tabular function, create a new row to represent a vertical shift.
- Identify the output row or column.
- Determine the magnitude of the shift.
- Add the shift to the value in each output cell. Add a positive value for up or a negative value for down.
A function [latex]f\left(x\right)[/latex] is given below. Create a table for the function [latex]g\left(x\right)=f\left(x\right)-3[/latex].
| [latex]x[/latex] | 2 | 4 | 6 | 8 |
| [latex]f\left(x\right)[/latex] | 1 | 3 | 7 | 11 |
Analysis of the Solution
As with the earlier vertical shift, notice the input values stay the same and only the output values change.