Systems of Equations and Inequalities: Background You’ll Need 3
Graph a linear inequality from standard and slope-intercept form
graphs of linear inequalities
Inequalities shade a half-plane.
Use a solid boundary line for [latex]\le[/latex] or [latex]\ge[/latex]
Use a dashed for [latex]<[/latex] or [latex]>[/latex].
Graphing Linear Inequalities in Slope-Intercept Form
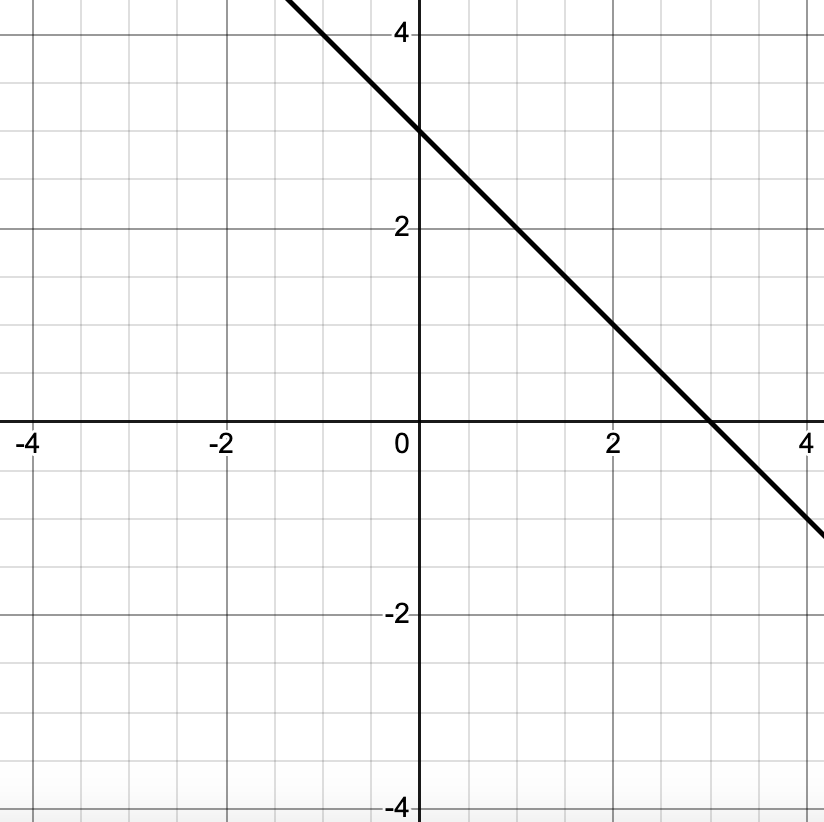
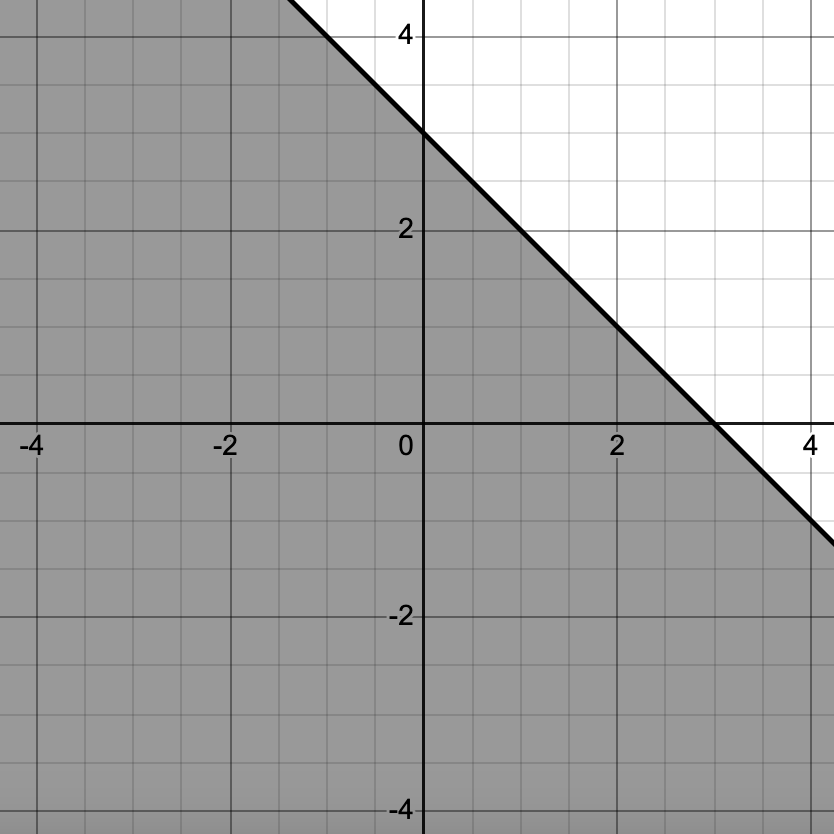
Graph [latex]y\le -\tfrac{1}{2}x+3[/latex].
Step 1: Draw the boundary lineGraph the line [latex]y=-\frac{1}{2}x+3[/latex]Because the inequality is [latex]\leq[/latex] the boundary is solid.
Step 2: Test a point not on the line.Test [latex](0,0)[/latex]Is the inequality true? [latex]\begin{align} 0 &\le -\frac{1}{2}(0)+3 \\ 0 &\le 0+3 && \text{since } -\frac{1}{2}\cdot 0=0 \\ 0 &\le 3 && \text{simplify} \end{align}[/latex]This is true. Shade the half-plane that contains [latex](0,0)[/latex]
Graphing Linear Inequalities in Slope-Intercept Form
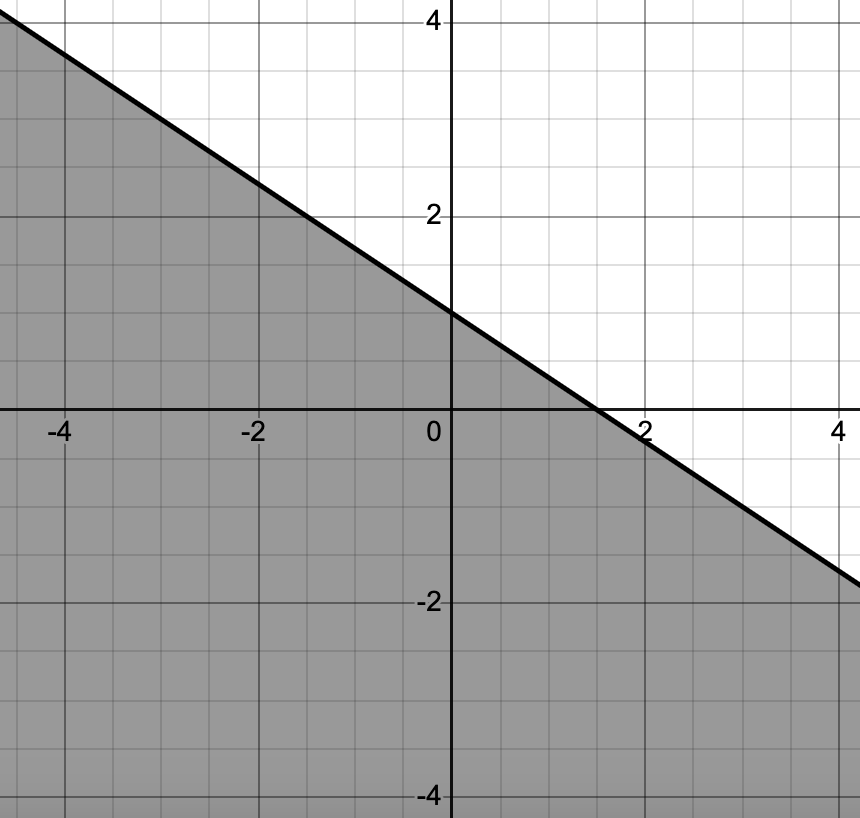
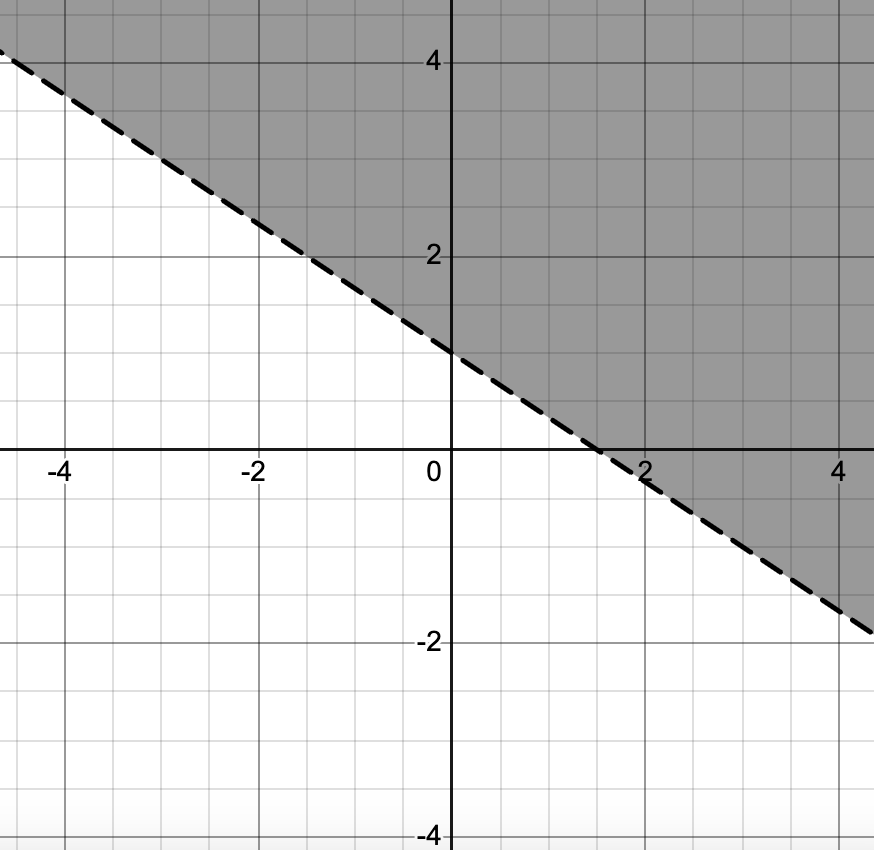
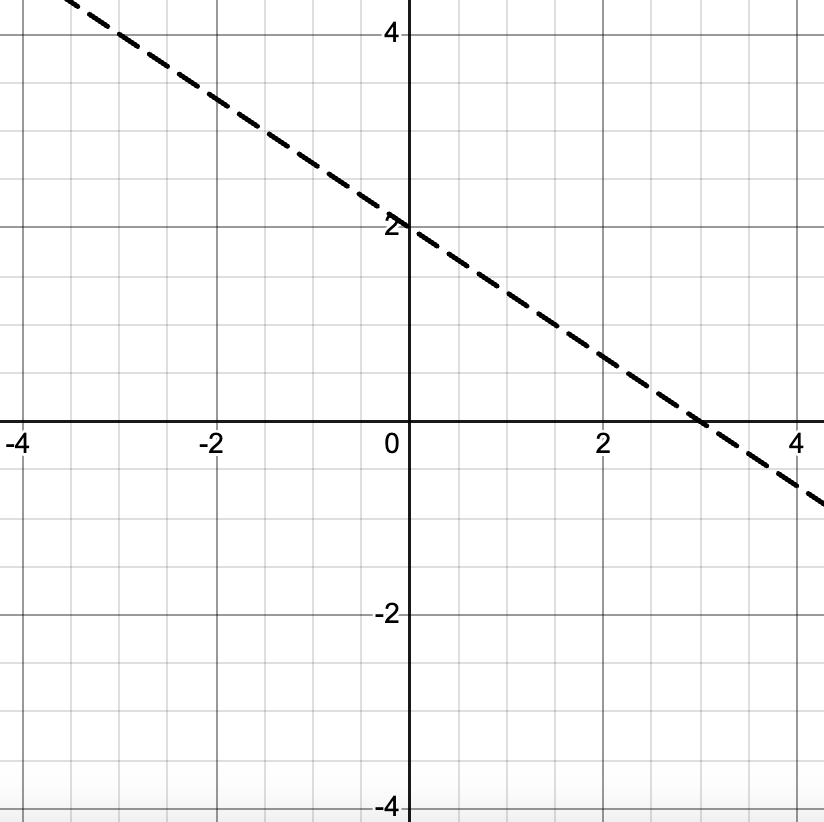
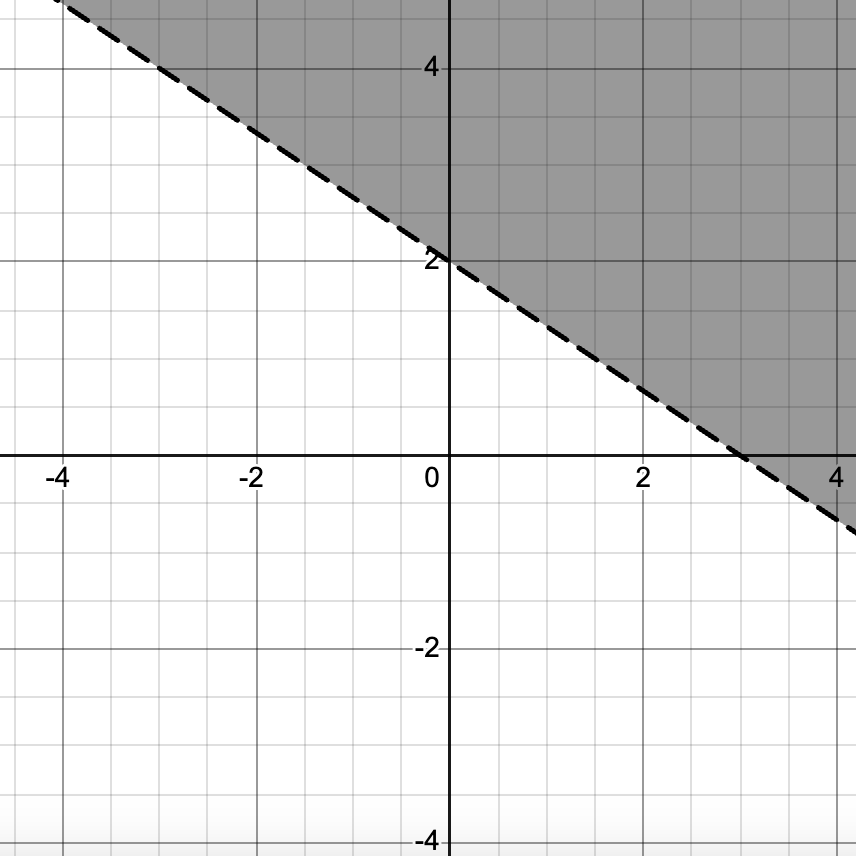
Graph [latex]2x+3y>6[/latex].
Convert [latex]3y>6-2x[/latex] to slope-intercept form:
\begin{align}
3y &> 6 – 2x \\
y &> \frac{6 – 2x}{3} && \text{divide both sides by }3\\
y &> \frac{6}{3} – \frac{2x}{3} && \text{split the fraction} \\
y &> 2 – \frac{2}{3}x && \text{simplify} \\
y &> -\frac{2}{3}x + 2 && \text{reorder to slope–intercept form}
\end{align}
Graph the boundary line using a dashed line (because [latex]>[/latex]).