- Graph linear functions
A linear function looks like [latex]y=mx+b[/latex], where [latex]m[/latex] is slope and [latex]b[/latex] is the [latex]y[/latex]-intercept.
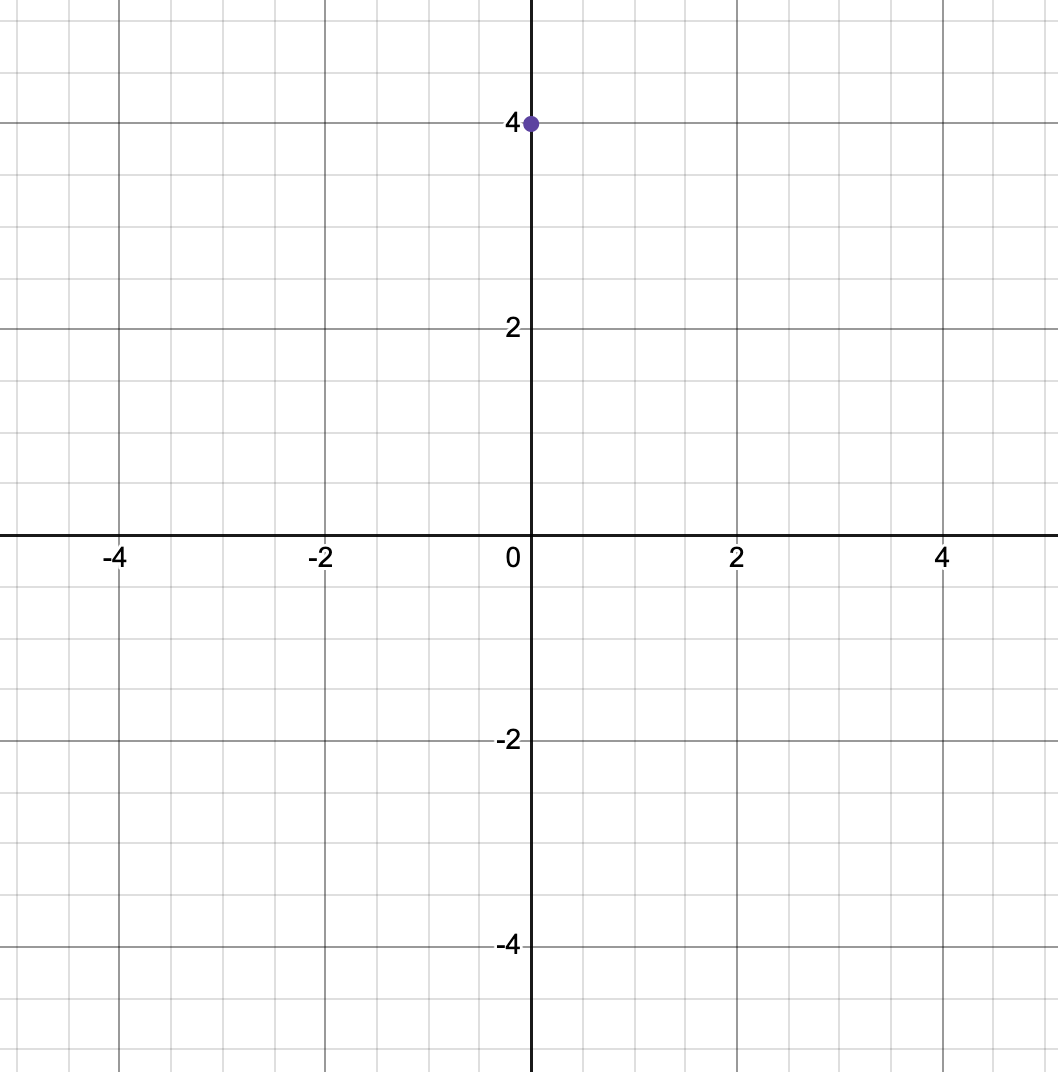
- Intercept: [latex](0,4)[/latex]
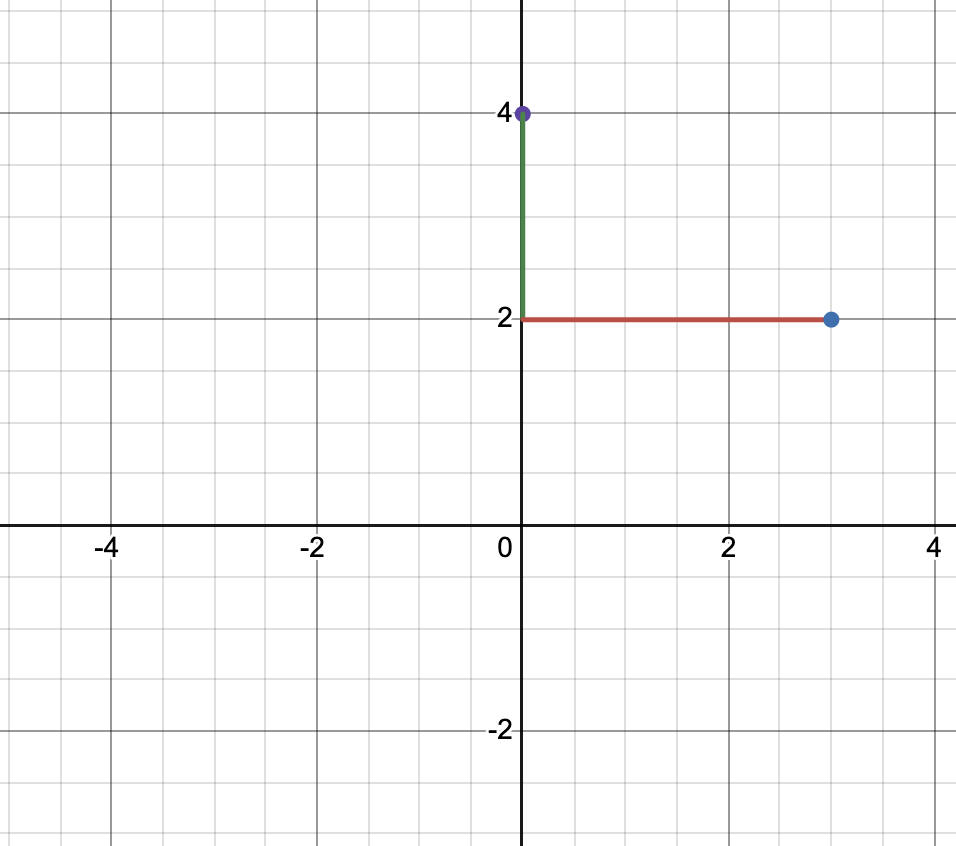
- Slope: [latex]-\frac{2}{3}[/latex] translates to
- Down 2 units
- Right 3 units
Step 1: Graph the intercept
Step 2: Use the slope to find a second point
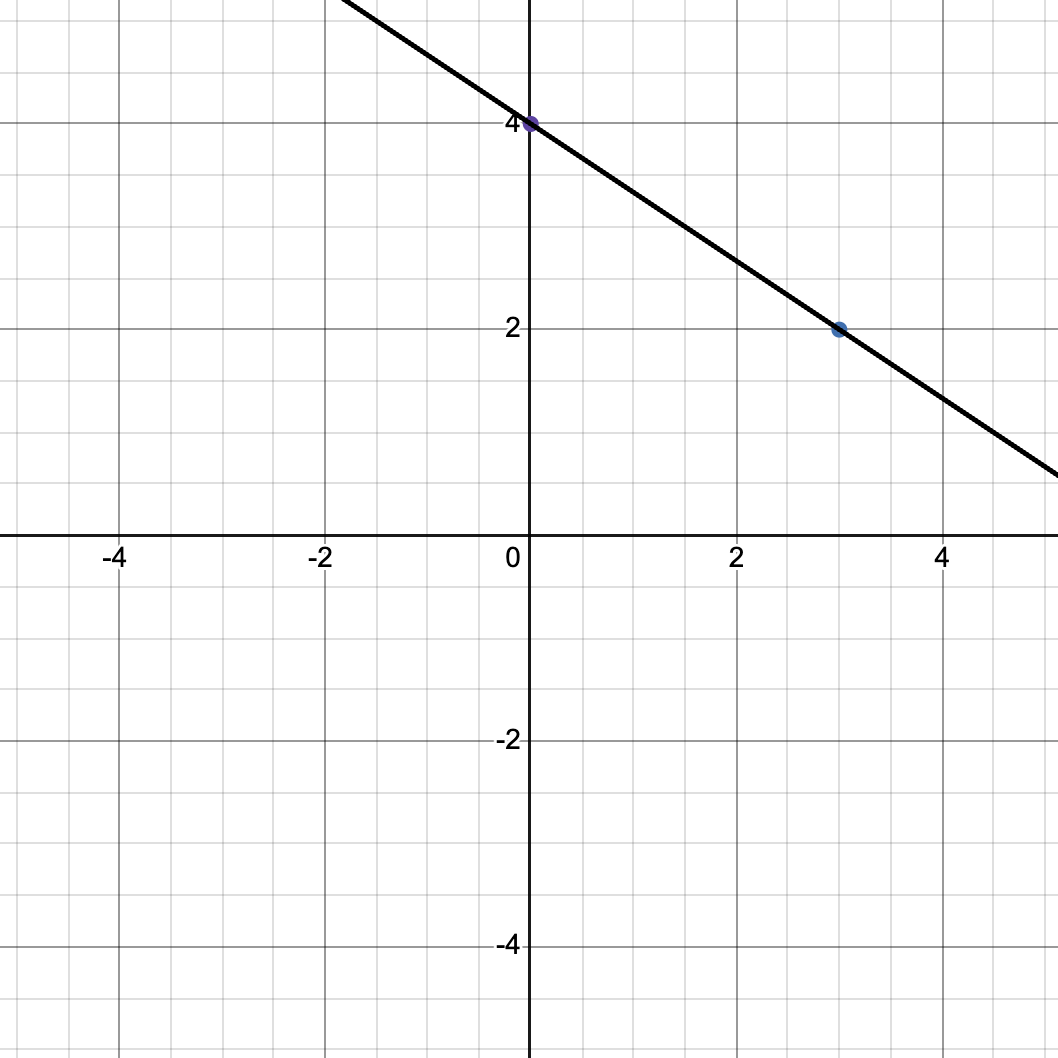
Step 3: Draw the line through the points