Behaviors of Functions
Using a Graph to Determine Where a Function is Increasing, Decreasing, or Constant
As part of exploring how functions change, we can identify intervals over which the function is changing in specific ways.
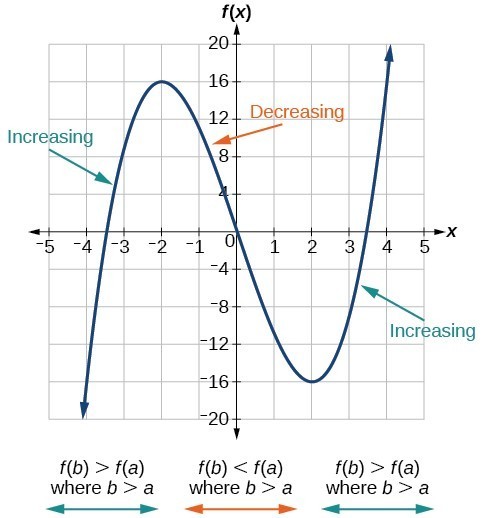
We say that a function is increasing on an interval if the function values increase as the input values increase within that interval. Similarly, a function is decreasing on an interval if the function values decrease as the input values increase over that interval. The average rate of change of an increasing function is positive, and the average rate of change of a decreasing function is negative. The graph below shows examples of increasing and decreasing intervals on a function.
While some functions are increasing (or decreasing) over their entire domain, many others are not. A value of the output where a function changes from increasing to decreasing (as we go from left to right, that is, as the input variable increases) is called a local maximum. If a function has more than one, we say it has local maxima. Similarly, a value of the output where a function changes from decreasing to increasing as the input variable increases is called a local minimum. The plural form is “local minima.” Together, local maxima and minima are called local extrema, or local extreme values, of the function. (The singular form is “extremum.”) Often, the term local is replaced by the term relative. In this text, we will use the term local.
- a function is said to be increasing if its function values increase as x increases;
- a function is said to be decreasing if its function values decrease as x increases.
Analyzing the Toolkit Functions for Increasing or Decreasing Intervals
We will now return to our toolkit functions and discuss their graphical behavior in the table below.
| Function | Increasing/Decreasing | Example |
|---|---|---|
| Constant Function[latex]f\left(x\right)={c}[/latex] | Neither increasing nor decreasing |  |
| Identity Function[latex]f\left(x\right)={x}[/latex] | Increasing |  |
| Quadratic Function[latex]f\left(x\right)={x}^{2}[/latex] | Increasing on [latex]\left(0,\infty\right)[/latex]Decreasing on [latex]\left(-\infty,0\right)[/latex]
Minimum at [latex]x=0[/latex] |
 |
| Cubic Function[latex]f\left(x\right)={x}^{3}[/latex] | Increasing |  |
| Reciprocal[latex]f\left(x\right)=\frac{1}{x}[/latex] | Decreasing [latex]\left(-\infty,0\right)\cup\left(0,\infty\right)[/latex] |  |
| Reciprocal Squared[latex]f\left(x\right)=\frac{1}{{x}^{2}}[/latex] | Increasing on [latex]\left(-\infty,0\right)[/latex]Decreasing on [latex]\left(0,\infty\right)[/latex] |  |
| Cube Root[latex]f\left(x\right)=\sqrt[3]{x}[/latex] | Increasing |  |
| Square Root[latex]f\left(x\right)=\sqrt{x}[/latex] | Increasing on [latex]\left(0,\infty\right)[/latex] |  |
| Absolute Value[latex]f\left(x\right)=|x|[/latex] | Increasing on [latex]\left(0,\infty\right)[/latex]Decreasing on [latex]\left(-\infty,0\right)[/latex]
Minimum at [latex]x=0[/latex] |
 |