Graphing a Linear Function from Point-Slope Form
Another way to graph a linear function is by using point-slope form. This form is useful when you know the slope and a single point on the line.
Method 1:
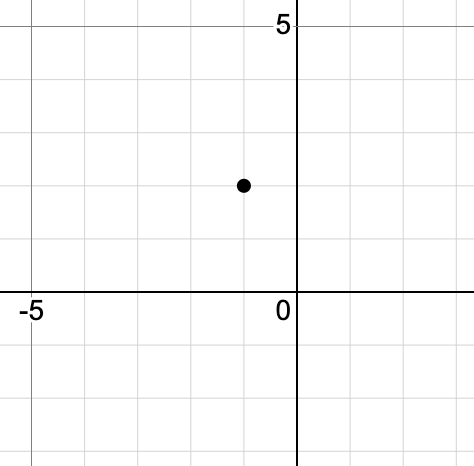
We can determine from the equation that the slope is [latex]m=3[/latex] and a point on the line is [latex](-1,2)[/latex].Step 1: Plot the point [latex](-1,2)[/latex].
 Step 2: Plot a second point using the slope. A slope of 3 means rise 3 and run 1.
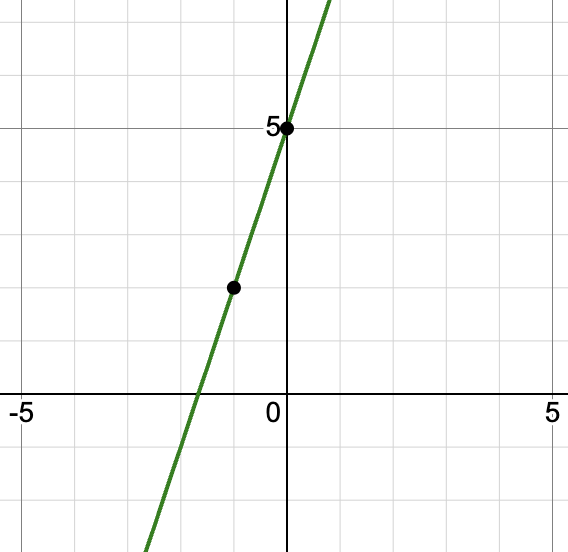
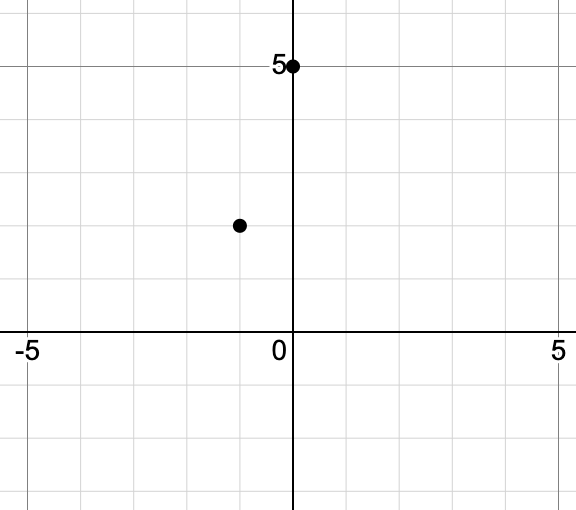 Step 3: Draw the line through the two points
Method 2:
To verify, we can rewrite the equation in slope-intercept form:
[latex]\begin{align} y - 2 &= 3(x + 1) \\ y - 2 &= 3x + 3 \\ y &= 3x + 5 \end{align}[/latex]
This tells us the y-intercept is [latex](0, 5)[/latex] so now we can graph the line using the slope and y-intercept.
- Identify the point and the slope
- Graph the point
- Use the slope to graph a second point
- Draw the line through the two points
Graphing a Linear Function from Standard Form
You can graph a line from standard form in two ways: by finding intercepts or by rewriting the equation in slope-intercept form.
Method 1: Using Intercepts
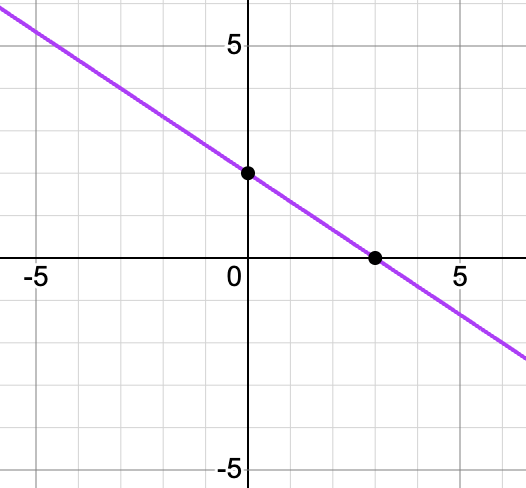
Step 2: Find the [latex]x[/latex]-intercept by setting [latex]y=0[/latex]:
[latex]\begin{align} 2x + 3(0) &= 6 \\ 2x &= 6 \\ x &= 3 \end{align}[/latex]
Step 3: Plot the points [latex](0,2)[/latex] and [latex](0,3)[/latex]
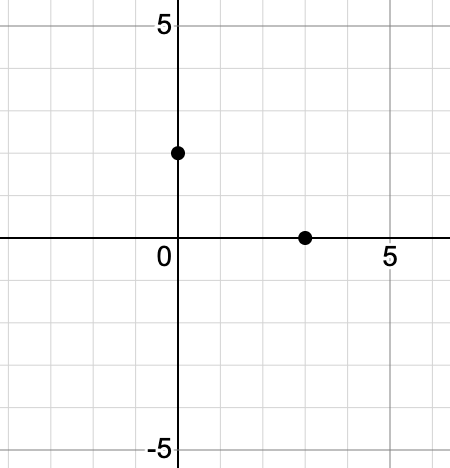
then draw the line through them.
Method 2: Slope-Intercept Form
You can also solve for [latex]y[/latex] and graph as usual.
[latex]\begin{array}{l} 2x + 3y = 6 \ 3y = -2x + 6 \ y = -\frac{2}{3}x + 2 \end{array}[/latex]
Now plot the y-intercept [latex](0, 2)[/latex] and use the slope [latex]-\frac{2}{3}[/latex] (down 2, right 3) to plot the next points
- Set [latex]x = 0[/latex] and solve for [latex]y[/latex] to find the [latex]y[/latex]-intercept
- Set [latex]y = 0[/latex] and solve for [latex]x[/latex] to find the [latex]x[/latex]-intercept
- Plot both intercepts
- Draw the line through the two points