Graphs of Linear Functions
3. If a horizontal line has the equation [latex]f\left(x\right)=a[/latex] and a vertical line has the equation [latex]x=a[/latex], what is the point of intersection? Explain why what you found is the point of intersection.
5. Explain how to find a line perpendicular to a linear function that passes through a given point.
For the following exercises, find the x- and y-intercepts of each equation.
13. [latex]g\left(x\right)=2x+4[/latex]
17. [latex]7x+2y=56[/latex]
25. Write an equation for a line parallel to [latex]g\left(x\right)=3x - 1[/latex] and passing through the point [latex]\left(4,9\right)[/latex].
27. Write an equation for a line perpendicular to [latex]p\left(t\right)=3t+4[/latex] and passing through the point [latex]\left(3,1\right)[/latex].
For the following exercises, sketch the graph of each equation.
45. [latex]g\left(x\right)=-3x+2[/latex]
47. [latex]k\left(x\right)=\frac{2}{3}x - 3[/latex]
51. [latex]x=-2[/latex]
53. [latex]y=3[/latex]
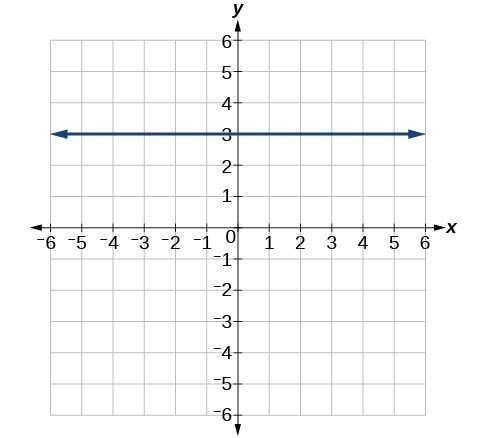
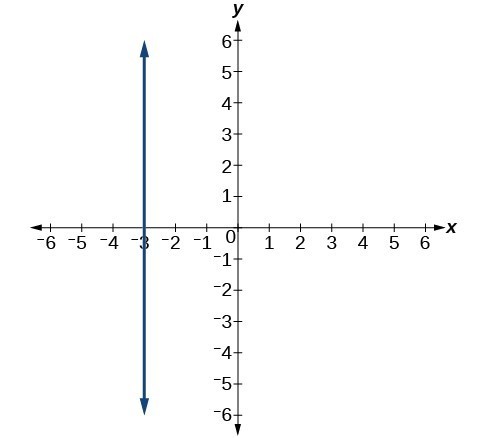
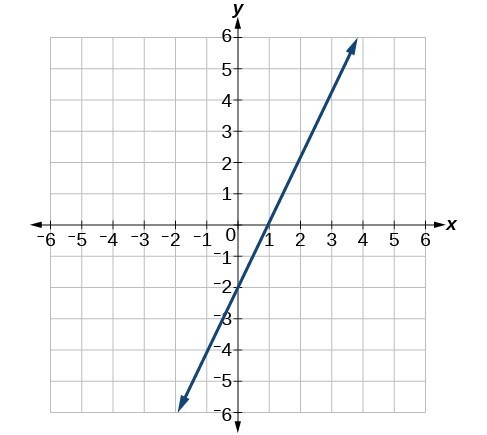
For the following exercises, write the equation of the line shown in the graph.
61.
63.
Linear Functions
3. Jessica is walking home from a friend’s house. After 2 minutes she is 1.4 miles from home. Twelve minutes after leaving, she is 0.9 miles from home. What is her rate in miles per hour?
5. A boat is 100 miles away from the marina, sailing directly toward it at 10 miles per hour. Write an equation for the distance of the boat from the marina after t hours.
For the following exercises, determine whether each function is increasing or decreasing.
15. [latex]f\left(x\right)=4x+3[/latex]
17. [latex]a\left(x\right)=5 - 2x[/latex]
For the following exercises, find the slope of the line that passes through the two given points.
25. [latex]\left(2,\text{ }4\right)[/latex] and [latex]\left(4,\text{ 10}\right)[/latex]
For the following exercises, given each set of information, find a linear equation satisfying the conditions, if possible.
33. Passes through [latex]\left(1,5\right)[/latex] and [latex]\left(4,11\right)[/latex]
37. x intercept at [latex]\left(-5,\text{ 0}\right)[/latex] and y intercept at [latex]\left(0,\text{ 4}\right)[/latex]
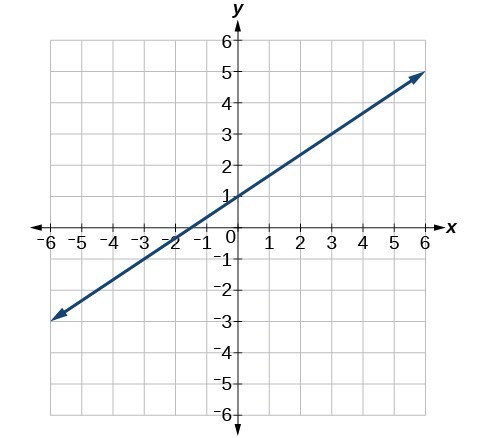
For the following exercises, write an equation for the lines graphed.
41.
For the following exercises, which of the tables could represent a linear function? For each that could be linear, find a linear equation that models the data.
47.
| x | 0 | 5 | 10 | 15 |
| g(x) | 5 | –10 | –25 | –40 |
49.
| x | 0 | 5 | 10 | 15 |
| f(x) | –5 | 20 | 45 | 70 |
50. Find the slope of the line graphed.
51. Write an equation in slope-intercept form for the line shown.
For the following exercises, determine whether the lines given by the equations below are parallel, perpendicular, or neither parallel nor perpendicular:
55. [latex]\begin{cases}2x - 6y=12\hfill \\ -x+3y=1\hfill \end{cases}[/latex]
For the following exercises, use the descriptions of the pairs of lines to find the slopes of Line 1 and Line 2. Is each pair of lines parallel, perpendicular, or neither?
59. Line 1: Passes through [latex]\left(5,11\right)[/latex] and [latex]\left(10,1\right)[/latex]
Line 2: Passes through [latex]\left(-1,3\right)[/latex] and [latex]\left(-5,11\right)[/latex]
61. Write an equation for a line perpendicular to [latex]f\left(x\right)=5x - 1[/latex] and passing through the point (5, 20).
69. A gym membership with two personal training sessions costs $125, while gym membership with five personal training sessions costs $260. What is cost per session?
71. A phone company charges for service according to the formula: [latex]C\left(n\right)=24+0.1n[/latex], where n is the number of minutes talked, and [latex]C\left(n\right)[/latex] is the monthly charge, in dollars. Find and interpret the rate of change and initial value.
75. Suppose that average annual income (in dollars) for the years 1990 through 1999 is given by the linear function: [latex]I\left(x\right)=1054x+23,286[/latex], where x is the number of years after 1990. Which of the following interprets the slope in the context of the problem?
a. As of 1990, average annual income was $23,286.
b. In the ten-year period from 1990–1999, average annual income increased by a total of $1,054.
c. Each year in the decade of the 1990s, average annual income increased by $1,054.
d. Average annual income rose to a level of $23,286 by the end of 1999.
Modeling with Linear Functions
3. Explain how to interpret the initial value in a word problem that uses a linear function.
4. Explain how to determine the slope in a word problem that uses a linear function.
For the following exercises, consider this scenario: A town’s population has been decreasing at a constant rate. In 2010 the population was 5,900. By 2012 the population had dropped 4,700. Assume this trend continues.
9. Predict the population in 2016.
10. Identify the year in which the population will reach 0.
For the following exercises, consider this scenario: The number of people afflicted with the common cold in the winter months steadily decreased by 205 each year from 2005 until 2010. In 2005, 12,025 people were afflicted.
25. Find the linear function that models the number of people inflicted with the common cold C as a function of the year, t.
27. When the function C is graphed, find and interpret the x– and y-intercepts.
For the following exercises, use the graph in below, which shows the profit, y, in thousands of dollars, of a company in a given year, t, where t represents the number of years since 1980.
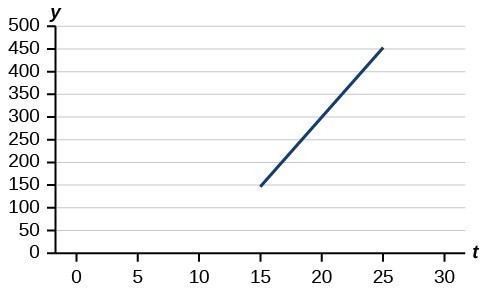
35. Find the linear function y, where y depends on t, the number of years since 1980.
36. Find and interpret the y-intercept.
37. Find and interpret the x-intercept.
38. Find and interpret the slope.
45. In 2004, a school population was 1001. By 2008 the population had grown to 1697. Assume the population is changing linearly.
a. How much did the population grow between the year 2004 and 2008?
b. How long did it take the population to grow from 1001 students to 1697 students?
c. What is the average population growth per year?
d. What was the population in the year 2000?
e. Find an equation for the population, P, of the school t years after 2000.
f. Using your equation, predict the population of the school in 2011.
51. The Federal Helium Reserve held about 16 billion cubic feet of helium in 2010 and is being depleted by about 2.1 billion cubic feet each year.
a. Give a linear equation for the remaining federal helium reserves, R, in terms of t, the number of years since 2010.
b. In 2015, what will the helium reserves be?
c. If the rate of depletion doesn’t change, in what year will the Federal Helium Reserve be depleted?
53. You are choosing between two different prepaid cell phone plans. The first plan charges a rate of 26 cents per minute. The second plan charges a monthly fee of $19.95 plus 11 cents per minute. How many minutes would you have to use in a month in order for the second plan to be preferable?
Fitting Linear Models to Data
7. A regression was run to determine whether there is a relationship between the diameter of a tree (x, in inches) and the tree’s age (y, in years). The results of the regression are given below. Use this to predict the age of a tree with diameter 10 inches.
[latex]\begin{cases}y=ax+b\\ a=6.301\\ b=-1.044\\ r=-0.970\end{cases}[/latex]
For the following exercises, draw a scatter plot for the data provided. Does the data appear to be linearly related?
9.
| 1 | 2 | 3 | 4 | 5 | 6 |
| 46 | 50 | 59 | 75 | 100 | 136 |
11.
| 1 | 3 | 5 | 7 | 9 | 11 |
| 1 | 9 | 28 | 65 | 125 | 216 |
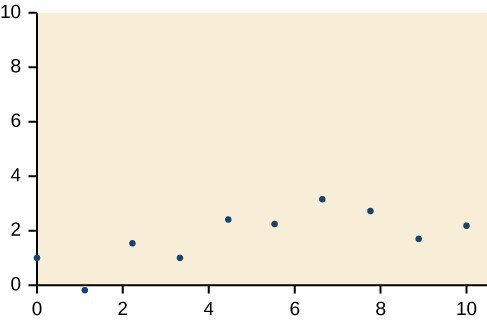
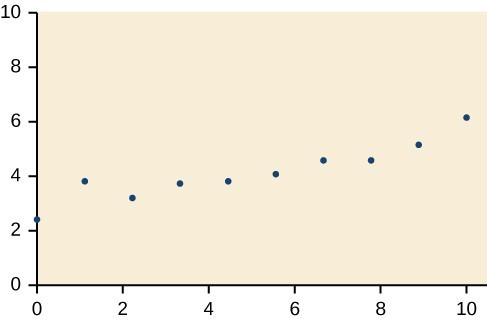
For the following exercises, match each scatterplot with one of the four specified correlations below.
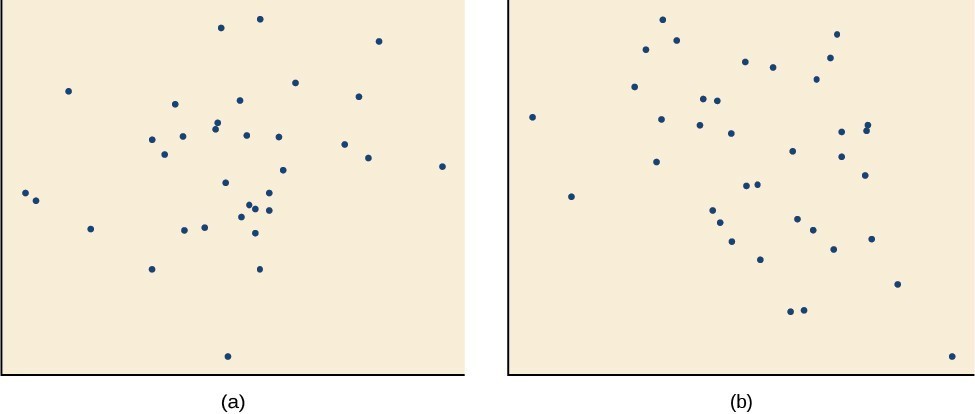
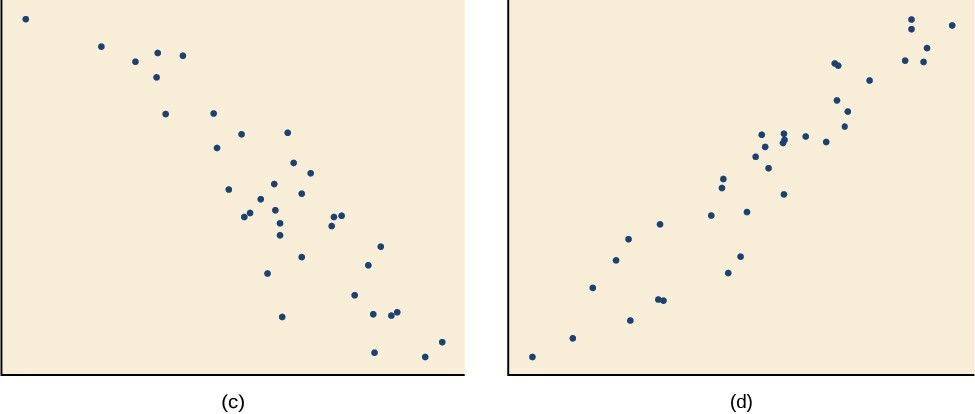
14. [latex]r=0.\text{95}[/latex]
15. [latex]r=-0.\text{89}[/latex]
16. [latex]r=0.26[/latex]
17. [latex]r=-0.39[/latex]
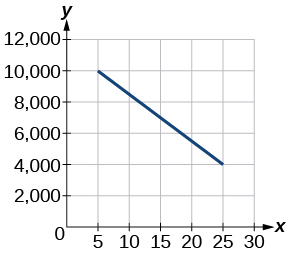
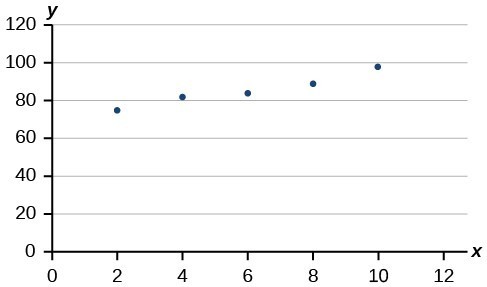
For the following exercises, draw a best-fit line for the plotted data.
19.
21.
23. The U.S. import of wine (in hectoliters) for several years is given below. Determine whether the trend appears linear. If so, and assuming the trend continues, in what year will imports exceed 12,000 hectoliters?
| Year | Imports |
| 1992 | 2665 |
| 1994 | 2688 |
| 1996 | 3565 |
| 1998 | 4129 |
| 2000 | 4584 |
| 2002 | 5655 |
| 2004 | 6549 |
| 2006 | 7950 |
| 2008 | 8487 |
| 2009 | 9462 |
For the following exercises, use each set of data to calculate the regression line using a calculator or other technology tool, and determine the correlation coefficient to 3 decimal places of accuracy.
25.
| x | 8 | 15 | 26 | 31 | 56 |
| y | 23 | 41 | 53 | 72 | 103 |
27.
| x | y | x | y |
| 3 | 21.9 | 11 | 15.76 |
| 4 | 22.22 | 12 | 13.68 |
| 5 | 22.74 | 13 | 14.1 |
| 6 | 22.26 | 14 | 14.02 |
| 7 | 20.78 | 15 | 11.94 |
| 8 | 17.6 | 16 | 12.76 |
| 9 | 16.52 | 17 | 11.28 |
| 10 | 18.54 | 18 | 9.1 |
For the following exercises, consider this scenario: The profit of a company decreased steadily over a ten-year span. The following ordered pairs show dollars and the number of units sold in hundreds and the profit in thousands of over the ten-year span (number of units sold, profit) for specific recorded years:
(46, 250), (48, 225), (50, 205), (52, 180), (54, 165).
41. Use linear regression to determine a function y, where the profit in thousands of dollars depends on the number of units sold in hundreds.
42. Predict when the profit will dip below the $25,000 threshold.
For the following exercises, use the graph showing the profit, y, in thousands of dollars, of a company in a given year, x, where x represents years since 1980.
69. Find the linear function y, where y depends on x, the number of years since 1980.
77. Draw a scatter plot for the data in the table below. If we wanted to know when the population would reach 15,000, would the answer involve interpolation or extrapolation?
| Year | Population |
| 1990 | 5,600 |
| 1995 | 5,950 |
| 2000 | 6,300 |
| 2005 | 6,600 |
| 2010 | 6,900 |
79. Draw a best-fit line for the plotted data.
For the following exercises, consider the data in the table below, which shows the percent of unemployed in a city of people 25 years or older who are college graduates is given below, by year.
| Year | Percent Graduates |
| 2000 | 6.5 |
| 2002 | 7.0 |
| 2005 | 7.4 |
| 2007 | 8.2 |
| 2010 | 9.0 |
80. Determine whether the trend appears to be linear. If so, and assuming the trend continues, find a linear regression model to predict the percent of unemployed in a given year to three decimal places.
81. In what year will the percentage exceed 12%?
83. Based on the set of data given below, calculate the regression line using a calculator or other technology tool, and determine the correlation coefficient to three decimal places.
| x | 10 | 12 | 15 | 18 | 20 |
| y | 36 | 34 | 30 | 28 | 22 |
For the following exercises, consider this scenario: The population of a city increased steadily over a ten-year span. The following ordered pairs show the population and the year over the ten-year span (population, year) for specific recorded years:
(3,600, 2000); (4,000, 2001); (4,700, 2003); (6,000, 2006)
85. Predict when the population will hit 12,000.
87. According to the model, what is the population in 2014?
Absolute Value Functions
3. When solving an absolute value function, the isolated absolute value term is equal to a negative number. What does that tell you about the graph of the absolute value function?
7. Describe all numbers [latex]x[/latex] that are at a distance of [latex]\frac{1}{2}[/latex] from the number −4. Express this using absolute value notation.
For the following exercises, solve the equations below and express the answer using set notation.
11. [latex]|6-x|=5[/latex]
17. [latex]5|x - 4|-7=2[/latex]
21. [latex]|3x - 2|=-7[/latex]
For the following exercises, find the x- and y-intercepts of the graphs of each function.
25. [latex]f\left(x\right)=2|x+1|-10[/latex]
27. [latex]f\left(x\right)=-3|x - 2|-1[/latex]
For the following exercises, solve each inequality and write the solution in interval notation.
29. [latex]\left|x - 2\right|>10[/latex]
31. [latex]|3x - 4|\le 8[/latex]
35. [latex]\left|\frac{3}{4}x - 5\right|\ge 7[/latex]
For the following exercises, graph the given functions by hand.
41. [latex]y=-|x|[/latex]
43. [latex]y=-|x - 3|-2[/latex]
49. [latex]f\left(x\right)=|3x+9|+2[/latex]
51. [latex]f\left(x\right)=-|x+4|-3[/latex]
61. The true proportion [latex]p[/latex] of people who give a favorable rating to Congress is 8% with a margin of error of 1.5%. Describe this statement using an absolute value equation.
63. A machinist must produce a bearing that is within 0.01 inches of the correct diameter of 5.0 inches. Using [latex]x[/latex] as the diameter of the bearing, write this statement using absolute value notation.