- Make a table of values and use it to graph a linear function
- Find and understand the slope and intercepts of a linear graph
- Look at a graph and write the equation of the line shown
Linear Functions
Imagine placing a plant in the ground one day and finding that it has doubled its height just a few days later. Although it may seem incredible, this can happen with certain types of bamboo species. These members of the grass family are the fastest-growing plants in the world. One species of bamboo has been observed to grow nearly [latex]1.5[/latex] inches every hour [1]. In a twenty-four hour period, this bamboo plant grows about [latex]36[/latex] inches, or an incredible [latex]3[/latex] feet! A constant rate of change, such as the growth cycle of this bamboo plant, is a linear function.
Just as with the growth of a bamboo plant, there are many situations that involve constant change over time. For example, consider the first commercial Maglev train in the world, the Shanghai Maglev Train. It carries passengers comfortably for a [latex]30[/latex]-kilometer trip from the airport to the subway station in only [latex]8[/latex] minutes.[2]
Suppose that a Maglev train were to travel a long distance, and the train maintains a constant speed of [latex]83[/latex] meters per second for a period of time once it is [latex]250[/latex] meters from the station. How can we analyze the train’s distance from the station as a function of time? In this section, we will investigate a type of function that is useful for this purpose and use it to investigate real-world situations such as the train’s distance from the station at a given point in time.
The function describing the train’s motion is a linear function, which is defined as a function with a constant rate of change, that is, a polynomial of degree [latex]1[/latex]. There are several ways to represent a linear function including word form, function notation, tabular form and graphical form. We will describe the train’s motion as a function using each method.
linear function
A linear function is characterized by a constant rate of change and can be represented as a polynomial of degree [latex]1[/latex] or as the graph of a straight line.
Representing a Linear Function in Word Form
Let’s begin by describing the linear function in words. For the train problem we just considered, the following word sentence may be used to describe the function relationship.
- The train’s distance from the station is a function of the time during which the train moves at a constant speed plus its original distance from the station when it began moving at constant speed.
The speed is the rate of change.
The rate of change for this example is constant, which means that it is the same for each input value. As the time (input) increases by 1 second, the corresponding distance (output) increases by 83 meters. The train began moving at this constant speed at a distance of 250 meters from the station.
Representing a Linear Function in Tabular Form
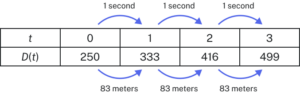
Another method of representing a linear function is through the use of a table. The relationship between the distance from the station and the time is represented in the table below. From the table, we can see that the distance changes by [latex]83[/latex] meters for every [latex]1[/latex] second increase in time.
representing a linear function in tabular form
In a table representing a linear function, each input-output pair forms a consistent pattern, exhibiting a constant rate of change between [latex]y[/latex]-values. To identify the function as linear, ensure that the difference between consecutive [latex]y[/latex]-values is the same when the [latex]x[/latex]-values increase by a consistent amount.
- "Fastest growing plant," Guinness World Records, accessed: April 1, 2026, http://www.guinnessworldrecords.com/world-records/fastest-growing-plant/. ↵
- "Shanghai Maglev Train — The Fastest Train in the World," China Highlights, accessed: April 1, 2026, http://www.chinahighlights.com/shanghai/transportation/maglev-train.htm ↵