Introduction to Calculus: Background You’ll Need 1
Evaluate piecewise functions given the graph
Evaluating Piecewise Functions from Graphs
A piecewise function is a function that is defined by different rules over different intervals of the input values. When a piecewise function is presented as a graph, each section of the graph represents a different rule.
To evaluate a piecewise function from a graph, the correct section of the graph must be identified for the given input value.
Piecewise function
A piecewise function uses different rules for different ranges of input values. Each rule applies only on its specified interval.
Interpreting the Graph
When evaluating from a graph, pay attention to:
The interval where each piece applies
Open circles, which indicate the value is not included
Closed circles, which indicate the value is included
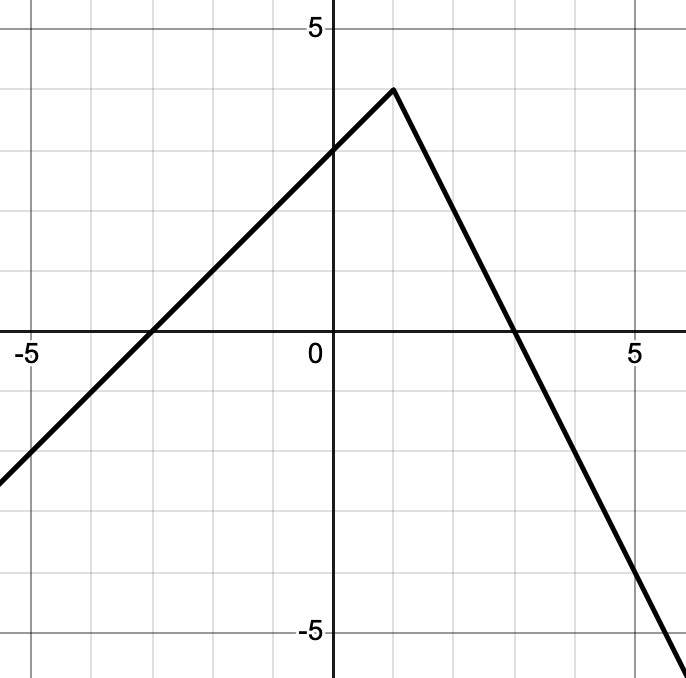
Consider the graph of a piecewise function shown below.
Evaluate [latex]f(-1)[/latex].
At [latex]x = -1[/latex], the point lies on a slanted line segment. The corresponding [latex]y[/latex]-value is [latex]2[/latex]. Since the point lies on the graph and is not an endpoint, the function value is determined by reading the height of the graph at that [latex]x[/latex]-value. Therefore, [latex]f(-1) = 2[/latex].
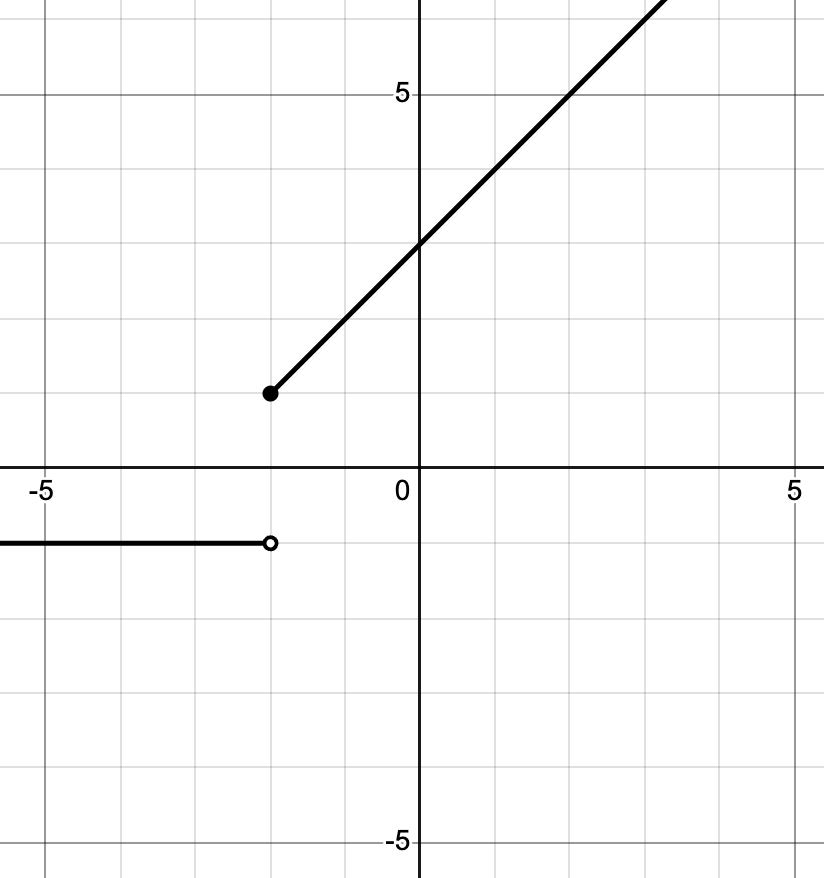
Use the graph to evaluate the function at [latex]x = -2[/latex].
Locate [latex]x = -1[/latex] on the [latex]x[/latex]-axis. At this value, the graph shows a filled (closed) circle at a height of [latex]1[/latex] and an open circle at a[latex](-1,-1)[/latex]. However, the open circle indicates that point is not included in the function. The function value is given by the filled point.