Analyzing the Graph of y = cot x and Its Variations
The last trigonometric function we need to explore is cotangent. The cotangent is defined by the reciprocal identity [latex]\cot x=\frac{1}{\tan x}[/latex]. Notice that the function is undefined when the tangent function is 0, leading to a vertical asymptote in the graph at 0, π, etc. Since the output of the tangent function is all real numbers, the output of the cotangent function is also all real numbers.
We can graph [latex]y=\cot x[/latex] by observing the graph of the tangent function because these two functions are reciprocals of one another. Where the graph of the tangent function decreases, the graph of the cotangent function increases. Where the graph of the tangent function increases, the graph of the cotangent function decreases.
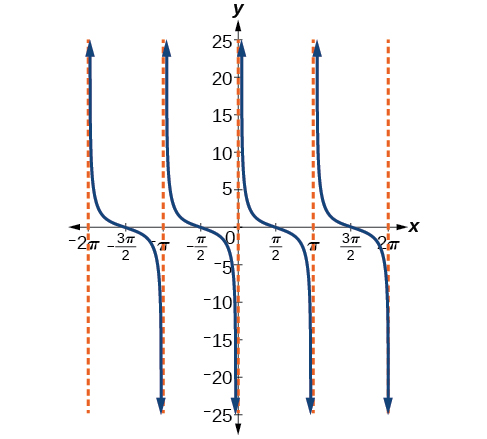
The cotangent graph has vertical asymptotes at each value of x where [latex]\tan x=0[/latex]; we show these in the graph below with dashed lines. Since the cotangent is the reciprocal of the tangent, [latex]\cot x[/latex] has vertical asymptotes at all values of x where [latex]\tan x=0[/latex] , and [latex]\cot x=0[/latex] at all values of x where tan x has its vertical asymptotes.
features of the graph of y = Acot(Bx)
- The amplitude is |A|.
- The period is [latex]P=\frac{\pi}{|B|}[/latex].
- The domain is [latex]x\ne\frac{\pi}{|B|}k[/latex], where k is an integer.
- The range is [latex](-\infty,\infty)[/latex].
- The asymptotes occur at [latex]x=\frac{\pi}{|B|}k[/latex], where k is an integer.
- [latex]y=A\cot(Bx)[/latex] is an odd function.
Graphing Variations of y = cot x
We can transform the graph of the cotangent in much the same way as we did for the tangent. The equation becomes the following.
- Express the function in the form [latex]f(x)=A\cot(Bx)[/latex].
- Identify the stretching factor, |A|.
- Identify the period, [latex]P=\frac{\pi}{|B|}[/latex].
- Draw the graph of [latex]y=A\tan(Bx)[/latex].
- Plot any two reference points.
- Use the reciprocal relationship between tangent and cotangent to draw the graph of [latex]y=A\cot(Bx)[/latex].
- Sketch the asymptotes.

- Express the function in the form [latex]f(x)=A\cot(Bx−C)+D[/latex].
- Identify the stretching factor, |A|.
- Identify the period, [latex]P=\frac{\pi}{|B|}[/latex].
- Identify the phase shift, [latex]\frac{C}{B}[/latex].
- Draw the graph of [latex]y=A\tan(Bx)[/latex] shifted to the right by [latex]\frac{C}{B}[/latex] and up by D.
- Sketch the asymptotes [latex]x =\frac{C}{B}+\frac{\pi}{|B|}k[/latex], where k is an integer.
- Plot any three reference points and draw the graph through these points.
