- Graph variations of y=tan x and y=cot x.
- Determine a function formula from a tangent or cotangent graph.
- Graph variations of y=sec x and y=csc x.
- Determine a function formula from a secant or cosecant graph.
Graph Variations of Tangent and Cotangent
The Main Idea
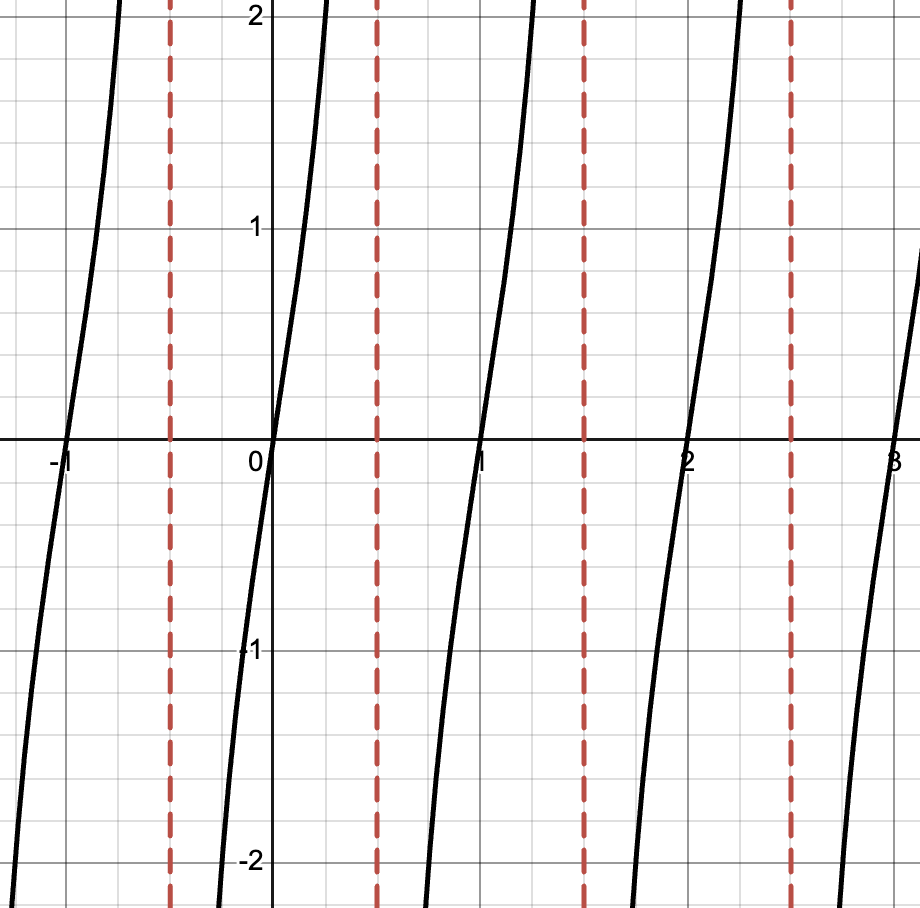
The graphs of [latex]y=\tan x[/latex] and [latex]y=\cot x[/latex] look different from sine and cosine because they have vertical asymptotes and repeat every [latex]\pi[/latex] units (instead of [latex]2\pi[/latex]). Variations of these graphs come from changing the parameters in the general forms:
-
[latex]y=a\tan(bx-c)+d[/latex]
-
[latex]y=a\cot(bx-c)+d[/latex]
Each parameter changes the graph in predictable ways:
-
[latex]a[/latex] stretches or reflects the graph vertically.
-
[latex]b[/latex] changes the period (the length of one cycle).
-
[latex]c[/latex] shifts the graph left or right (phase shift).
-
[latex]d[/latex] shifts the graph up or down (vertical shift).
Quick Tips: Graphing Variations of Tangent and Cotangent
-
Base Graph Features
-
[latex]y=\tan x[/latex]: period [latex]\pi[/latex], asymptotes at [latex]x=\dfrac{\pi}{2}+k\pi[/latex].
-
[latex]y=\cot x[/latex]: period [latex]\pi[/latex], asymptotes at [latex]x=k\pi[/latex].
-
-
Period Changes
-
Formula: [latex]\text{Period}=\dfrac{\pi}{b}[/latex].
-
Larger [latex]b[/latex] = compressed, smaller [latex]b[/latex] = stretched.
-
-
Phase Shift [latex]\dfrac{c}{b}[/latex]
-
Moves the graph left or right.
-
Asymptotes shift accordingly.
-
-
Vertical Stretch/Reflection
-
[latex]a[/latex] changes steepness of the graph.
-
Negative [latex]a[/latex] reflects across the x-axis.
-
-
Vertical Shift [latex]d[/latex]
-
Moves the midline up or down.
-
Asymptotes remain vertical.
-
-
Graphing Strategy
-
Step 1: Find the period using [latex]\dfrac{\pi}{b}[/latex].
-
Step 2: Locate the asymptotes.
-
Step 3: Apply phase and vertical shifts.
-
Step 4: Plot key points ([latex]\pm 1[/latex] for tangent; reciprocal behavior for cotangent).
-
Step 5: Sketch the curve between asymptotes.
-
You can view the transcript for “Trigonometry – The graphs of tan and cot” here (opens in new window).
Function Formulas from Tangent and Cotangent Graphs
The Main Idea
To write a function formula from a tangent or cotangent graph, we analyze its key features: the period, the phase shift (location of asymptotes or intercepts), any vertical shift, and the steepness of the curve. Tangent and cotangent graphs both repeat every [latex]\pi[/latex], but parameters in the general forms
-
-
-
-
-
-
[latex]y=a\tan(bx-c)+d[/latex]
-
[latex]y=a\cot(bx-c)+d[/latex]
-
-
-
-
-
control how the graph is stretched, shifted, or reflected. By identifying these features from the graph, we can reconstruct the exact equation.
Quick Tips: Building Tangent or Cotangent Formulas
-
Determine the Period
-
For tangent and cotangent, [latex]\text{Period}=\dfrac{\pi}{b}[/latex].
-
Measure the distance between consecutive asymptotes (or repeating points) to find [latex]b[/latex].
-
-
Locate Phase Shift
-
Tangent asymptotes: [latex]x=\dfrac{c}{b}+\dfrac{\pi}{2b}+k\dfrac{\pi}{b}[/latex].
-
Cotangent asymptotes: [latex]x=\dfrac{c}{b}+k\dfrac{\pi}{b}[/latex].
-
Identify where the central asymptote (for tangent) or intercept (for cotangent) has shifted.
-
-
Find Vertical Shift [latex]d[/latex]
-
Midline of the graph is [latex]y=d[/latex].
-
Check if the curve has been moved up or down.
-
-
Determine [latex]a[/latex] (Stretch/Reflection)
-
[latex]a[/latex] changes the steepness.
-
Negative [latex]a[/latex] flips the graph across the midline.
-
-
Choose Tangent or Cotangent Form
-
Tangent passes through the origin (before shifts) and increases left to right.
-
Cotangent decreases left to right, starting with an asymptote at the origin.
-
-
Write the Equation
-
Plug amplitude [latex]a[/latex], period factor [latex]b[/latex], phase shift [latex]c[/latex], and vertical shift [latex]d[/latex] into [latex]y=a\tan(bx-c)+d[/latex] or [latex]y=a\cot(bx-c)+d[/latex].
-
Graph Variations of Secant and Cosecant
The Main Idea
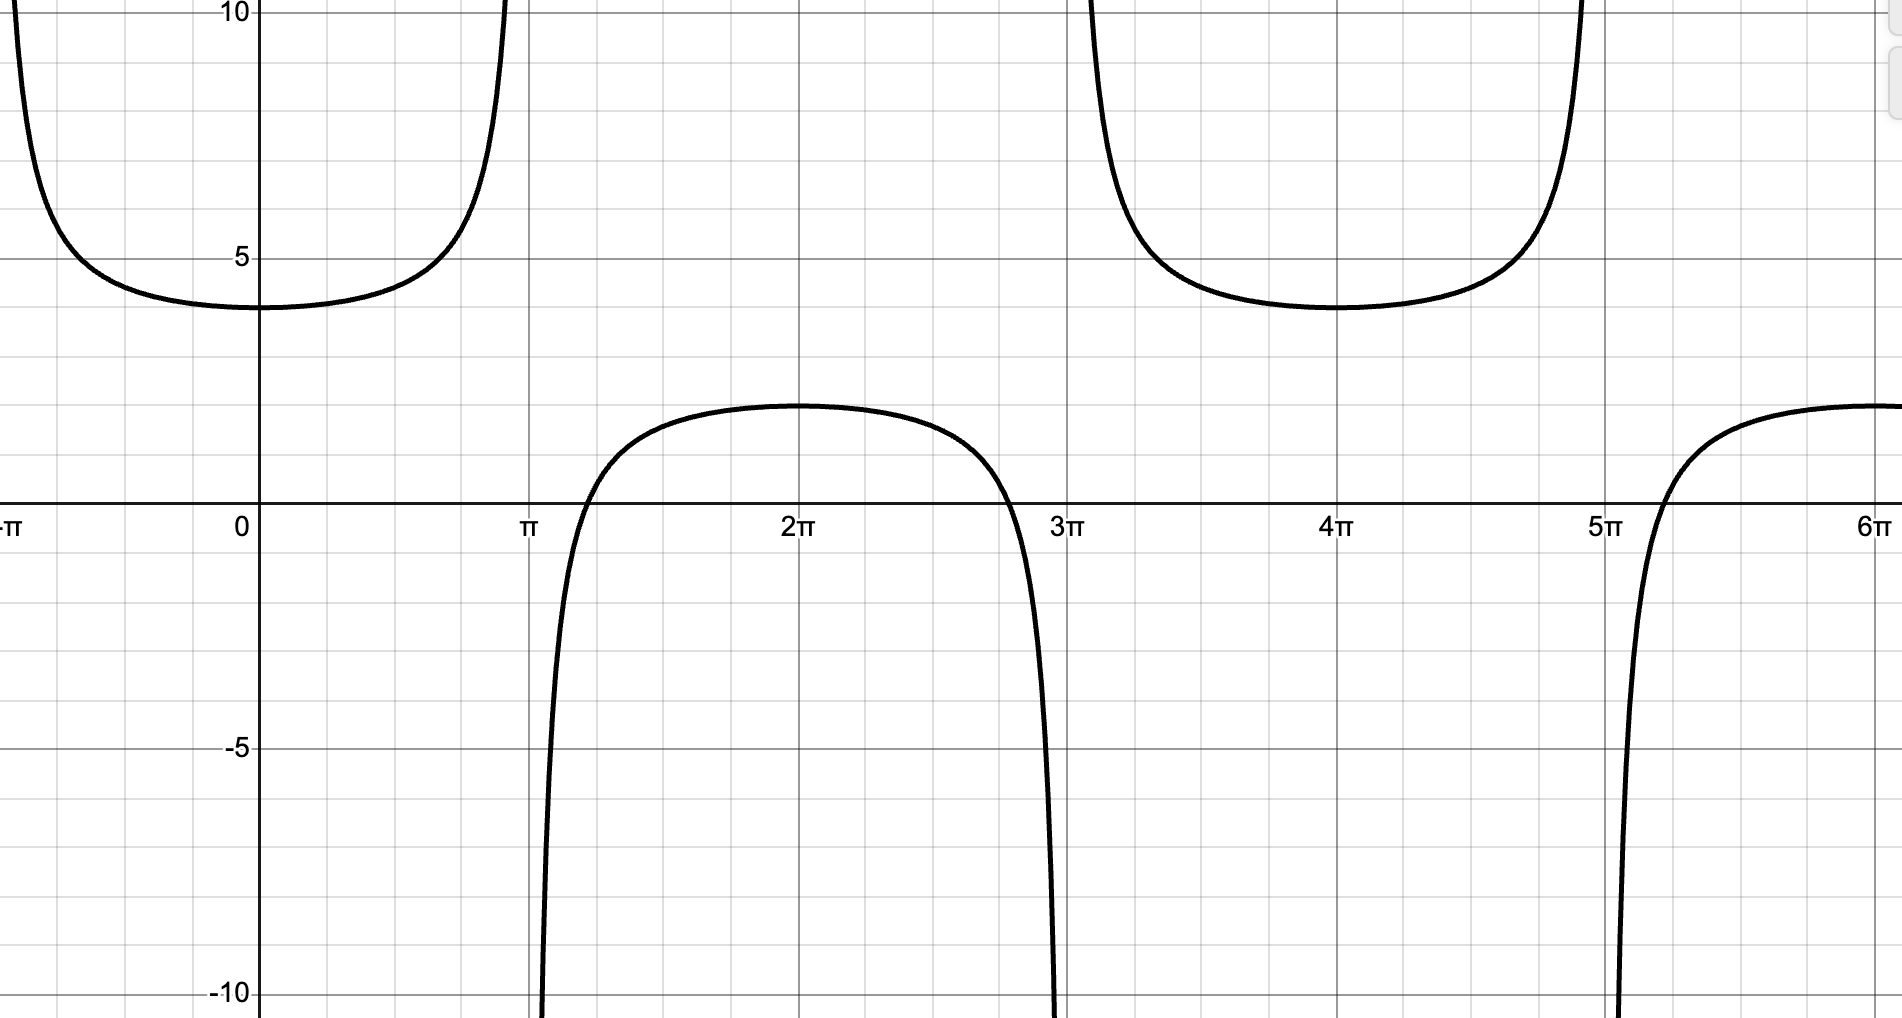
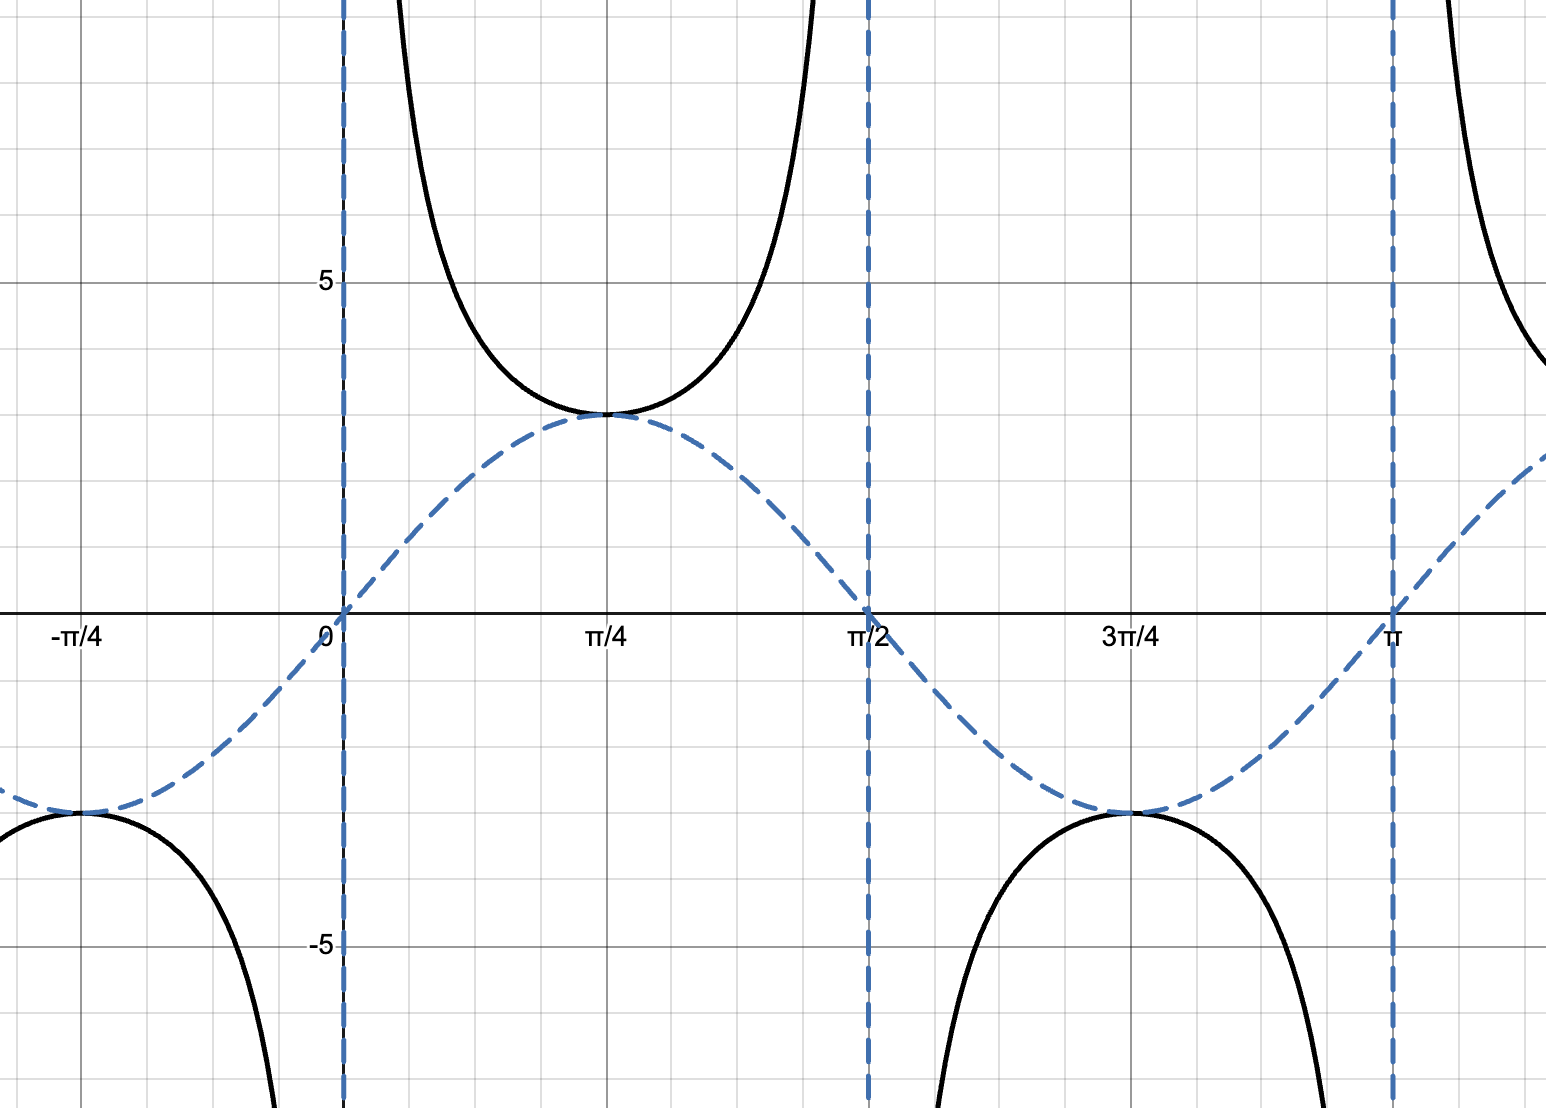
The graphs of [latex]y=\sec x[/latex] and [latex]y=\csc x[/latex] are built from cosine and sine, since [latex]\sec x=\dfrac{1}{\cos x}[/latex] and [latex]\csc x=\dfrac{1}{\sin x}[/latex]. They feature repeating U-shaped and inverted U-shaped branches with vertical asymptotes where sine or cosine equals zero. Variations of these graphs are created by changing the parameters in the general forms:
-
-
-
-
-
-
[latex]y=a\sec(bx-c)+d[/latex]
-
[latex]y=a\csc(bx-c)+d[/latex]
-
-
-
-
-
Each parameter controls how the graph is stretched, shifted, or reflected.
Quick Tips: Graphing Variations of Secant and Cosecant
-
Base Graph Features
-
[latex]y=\sec x[/latex]: period [latex]2\pi[/latex], asymptotes at [latex]x=\dfrac{\pi}{2}+k\pi[/latex].
-
[latex]y=\csc x[/latex]: period [latex]2\pi[/latex], asymptotes at [latex]x=k\pi[/latex].
-
-
Period Changes
-
Formula: [latex]\text{Period}=\dfrac{2\pi}{b}[/latex].
-
Adjusts how wide each repeating cycle is.
-
-
Phase Shift [latex]\dfrac{c}{b}[/latex]
-
Moves the graph left or right.
-
Asymptotes and branches shift accordingly.
-
-
Vertical Stretch/Reflection [latex]a[/latex]
-
[latex]a[/latex] changes the distance from the midline to the minimum/maximum points of each branch.
-
Negative [latex]a[/latex] reflects the branches across the midline.
-
-
Vertical Shift [latex]d[/latex]
-
Moves the midline up or down, shifting the entire graph.
-
Asymptotes stay vertical, but branch positions adjust.
-
-
Graphing Strategy
-
Step 1: Start with sine or cosine as a guide.
-
Step 2: Identify asymptotes where sine or cosine = 0.
-
Step 3: Plot key points at maximum/minimum distances from the midline.
-
Step 4: Sketch U-shaped and inverted U-shaped branches between asymptotes.
-
Function Formula from Secant and Cosecant Graphs
The Main Idea
To determine a function formula from a secant or cosecant graph, we use the fact that these graphs are built as reciprocals of cosine and sine. The graph’s midline, vertical shift, period, phase shift, and stretch/reflection can all be read directly from its repeating U-shaped or inverted U-shaped branches. Once these features are identified, they are plugged into the general forms:
-
-
-
-
-
-
[latex]y=a\sec(bx-c)+d[/latex]
-
[latex]y=a\csc(bx-c)+d[/latex]
-
-
-
-
-
Recognizing the asymptotes and midline first helps anchor the equation.
Quick Tips: Building Secant or Cosecant Formulas
-
Determine the Period
-
Formula: [latex]\text{Period}=\dfrac{2\pi}{b}[/latex].
-
Measure the distance between repeating branches or asymptotes.
-
-
Locate the Phase Shift
-
Secant asymptotes: align with where cosine = 0, i.e. [latex]x=\dfrac{\pi}{2}+k\pi[/latex].
-
Cosecant asymptotes: align with where sine = 0, i.e. [latex]x=k\pi[/latex].
-
Compare the shifted asymptotes to find [latex]\dfrac{c}{b}[/latex].
-
-
Find the Vertical Shift [latex]d[/latex]
-
The midline of the graph is [latex]y=d[/latex].
-
This is halfway between a maximum and minimum.
-
-
Identify the Stretch/Reflection [latex]a[/latex]
-
Distance from the midline to the “top” or “bottom” of a branch = [latex]|a|[/latex].
-
If the branch opens downward where it normally opens upward, [latex]a[/latex] is negative.
-
-
Choose Secant vs. Cosecant
-
If the branches line up with cosine (max/min at [latex]x=0[/latex]), use secant.
-
If the branches line up with sine (crossing at [latex]x=0[/latex]), use cosecant.
-
-
Write the Equation
-
Substitute values of [latex]a[/latex], [latex]b[/latex], [latex]c[/latex], and [latex]d[/latex] into the formula.
-
Example: A secant graph with midline [latex]y=1[/latex], amplitude [latex]2[/latex], period [latex]\pi[/latex], and shift right [latex]\dfrac{\pi}{4}[/latex] would be
[latex]y=2\sec!\left(2x-\dfrac{\pi}{2}\right)+1[/latex].
-