Finding the [latex]y[/latex]-intercept of a Line
Another key feature of a linear function is the [latex]y[/latex]-intercept: the point at which the graph of a function crosses the [latex]y[/latex]-axis. The [latex]y[/latex]-intercept is the [latex]y[/latex]-coordinate of the point where the input value is zero.
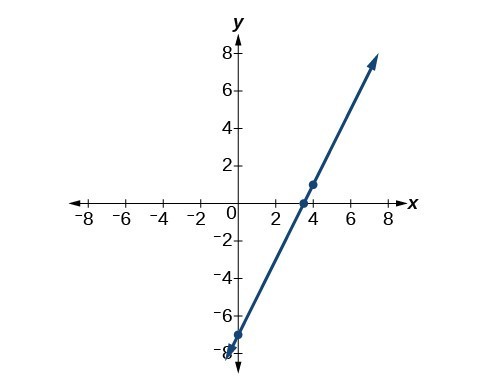
To find the [latex]y[/latex]-intercept, substitute [latex]x = 0[/latex] into the function and solve for [latex]f(x)[/latex] or [latex]y[/latex]. For example, consider the function shown:
[latex]f\left(x\right)=3x - 6[/latex]
Substitute [latex]x = 0[/latex] into the function:
[latex]\begin{array}{l}f(0)=3(0) - 6\hfill \\ f(0)=0 - 6\hfill \\ f(0)=-6\hfill \end{array}[/latex]
The graph of the function crosses the [latex]y[/latex]-axis at the point [latex](0, -6)[/latex].
[latex]y[/latex]-intercept of a Line
The [latex]y[/latex]-intercept of a function is the value of [latex]f(x)[/latex] when [latex]x = 0[/latex].
In slope-intercept form, [latex]f(x) = mx + b[/latex], the [latex]y[/latex]-intercept is the constant [latex]b[/latex].
In context, the [latex]y[/latex] typically represents the initial value or starting point of the function.
Find the [latex]y[/latex]-intercept of the following:
[latex]f\left(x\right)=\frac{1}{2}x - 3[/latex]