To find points on a function’s graph, select input values, evaluate the function at these inputs, and calculate the corresponding outputs. These input-output pairs form coordinates, which you can plot on a grid. To graph a linear function, you should evaluate it at least two input values to identify at least two points.
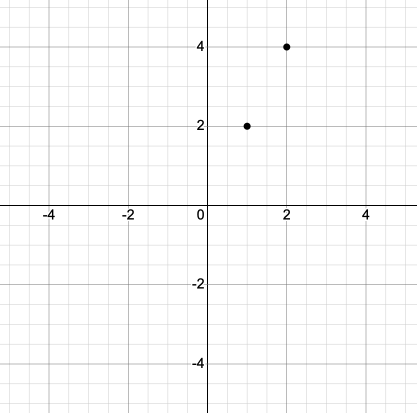
Given the function [latex]f\left(x\right)=2x[/latex], we might use the input values [latex]1[/latex] and [latex]2[/latex].[latex]\\[/latex] Evaluating the function for an input value of [latex]1[/latex] yields an output value of [latex]2[/latex] which is represented by the point [latex](1, 2)[/latex]. [latex]\\[/latex]Evaluating the function for an input value of [latex]2[/latex] yields an output value of [latex]4[/latex] which is represented by the point [latex](2, 4)[/latex].Plot each point on the coordinate plane:
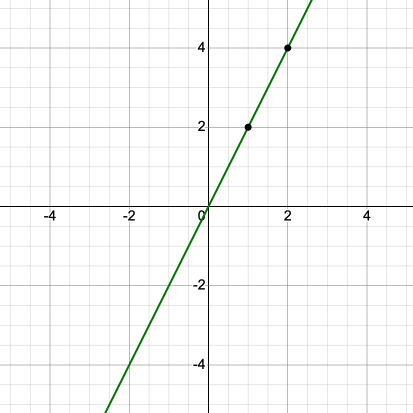
Then connect the points with a straight line: How To: Given a linear function, graph by plotting points.
Choose a minimum of two input values.
Evaluate the function at each input value.
Use the resulting output values to identify coordinate pairs.
Plot the coordinate pairs on a grid.
Draw a line through the points.
Graph the following by plotting points.
[latex]f\left(x\right)=-\frac{2}{3}x+5[/latex]
Begin by choosing input values. This function includes a fraction with a denominator of [latex]3[/latex] so let’s choose multiples of [latex]3[/latex] as input values. We will choose [latex]0[/latex], [latex]3[/latex], and [latex]6[/latex].
[latex]\\[/latex]
Evaluate the function at each input value and use the output value to identify coordinate pairs.
Plot the coordinate pairs and draw a line through the points. The graph below is of the function [latex]f\left(x\right)=-\frac{2}{3}x+5[/latex].
Analysis of the Solution
The graph of the function is a line as expected for a linear function. In addition, the graph has a downward slant which indicates a negative slope. This is also expected from the negative constant rate of change in the equation for the function.
If your equation has a fraction, you’ll have to divide the number plugged in by whatever is in the denominator. In the previous example, choosing multiples of [latex]3[/latex] will have the easiest calculation due to the [latex]\frac{2}{3}[/latex] in the equation.
![The graph of the linear function [latex]f\left(x\right)=-\frac{2}{3}x+5[/latex].](https://s3-us-west-2.amazonaws.com/courses-images/wp-content/uploads/sites/896/2016/10/21184320/CNX_Precalc_Figure_02_02_0012.jpg)