Creating a table is a way to determine limits using numeric information. We create a table of values in which the input values of [latex]x[/latex] approach [latex]a[/latex] from both sides. Then we determine if the output values get closer and closer to some real value, the limit [latex]L[/latex].
Let’s consider an example using the following function:
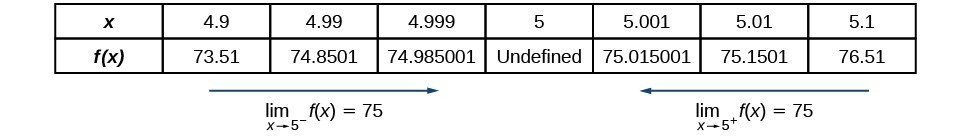
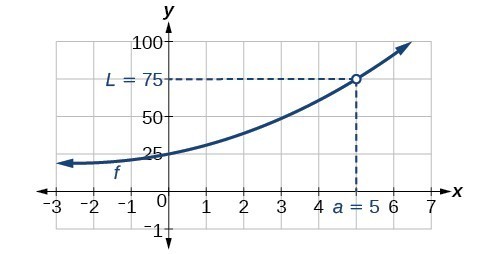
To create the table, we evaluate the function at values close to [latex]x=5[/latex]. We use some input values less than 5 and some values greater than 5. The table values show that when [latex]x>5[/latex] but nearing 5, the corresponding output gets close to 75. When [latex]x>5[/latex] but nearing 5, the corresponding output also gets close to 75.
Remember that [latex]f\left(5\right)[/latex] does not exist.
How To: Given a function [latex]f[/latex], use a table to find the limit as [latex]x[/latex] approaches [latex]a[/latex] and the value of [latex]f\left(a\right)[/latex], if it exists.
Choose several input values that approach [latex]a[/latex] from both the left and right. Record them in a table.
Evaluate the function at each input value. Record them in the table.
Determine if the table values indicate a left-hand limit and a right-hand limit.
If the left-hand and right-hand limits exist and are equal, there is a two-sided limit.
Replace [latex]x[/latex] with [latex]a[/latex] to find the value of [latex]f\left(a\right)[/latex].
Numerically estimate the limit of the following expression by setting up a table of values on both sides of the limit.
We can estimate the value of a limit, if it exists, by evaluating the function at values near [latex]x=0[/latex]. We cannot find a function value for [latex]x=0[/latex] directly because the result would have a denominator equal to 0, and thus would be undefined.
We create Figure 10 by choosing several input values close to [latex]x=0[/latex], with half of them less than [latex]x=0[/latex] and half of them greater than [latex]x=0[/latex]. Note that we need to be sure we are using radian mode. We evaluate the function at each input value to complete the table.
The table values indicate that when [latex]x<0[/latex] but approaching 0, the corresponding output nears [latex]\frac{5}{3}[/latex].
When [latex]x>0[/latex] but approaching 0, the corresponding output also nears [latex]\frac{5}{3}[/latex].
Graph the function on a viewing window. A graphical check shows both branches of the graph of the function get close to the output 75 as [latex]x[/latex] nears 5. Furthermore, we can use the ‘trace’ feature of a graphing calculator. By approaching [latex]x=5[/latex] we may numerically observe the corresponding outputs getting close to [latex]75[/latex].
Numerically estimate the limit of the following function by making a table:
Both methods have advantages. Graphing allows for quick inspection. Tables can be used when graphical utilities aren’t available, and they can be calculated to a higher precision than could be seen with an unaided eye inspecting a graph.With the use of a graphing utility, if possible, determine the left- and right-hand limits of the following function as [latex]x[/latex] approaches 0. If the function has a limit as [latex]x[/latex] approaches 0, state it. If not, discuss why there is no limit.
We can use a graphing utility to investigate the behavior of the graph close to [latex]x=0[/latex]. Centering around [latex]x=0[/latex], we choose two viewing windows such that the second one is zoomed in closer to [latex]x=0[/latex] than the first one.
Even closer to zero, we are even less able to distinguish any limits.The closer we get to 0, the greater the swings in the output values are. That is not the behavior of a function with either a left-hand limit or a right-hand limit. And if there is no left-hand limit or right-hand limit, there certainly is no limit to the function [latex]f\left(x\right)[/latex] as [latex]x[/latex] approaches 0.We write
[latex]\underset{x\to {0}^{-}}{\mathrm{lim}}\left(3\sin \left(\frac{\pi }{x}\right)\right)\text{ does not exist}[/latex].
[latex]\underset{x\to {0}^{+}}{\mathrm{lim}}\left(3\sin \left(\frac{\pi }{x}\right)\right)\text{ does not exist}[/latex].
[latex]\underset{x\to 0}{\mathrm{lim}}\left(3\sin \left(\frac{\pi }{x}\right)\right)\text{ does not exist}[/latex].
Numerically estimate the following limit: [latex]\underset{x\to 0}{\mathrm{lim}}\left(\sin \left(\dfrac{2}{x}\right)\right)[/latex].


![Graph of a sinusodial function zoomed in at [-2, 2] by [-3, 3].](https://s3-us-west-2.amazonaws.com/courses-images/wp-content/uploads/sites/3675/2018/09/27185243/CNX_Precalc_Figure_12_01_011F2.jpg)
![Graph of the same sinusodial function as in the previous image zoomed in at [-0.1, 0.1] by [-3. 3].](https://s3-us-west-2.amazonaws.com/courses-images/wp-content/uploads/sites/3675/2018/09/27185245/CNX_Precalc_Figure_12_01_012F2.jpg)