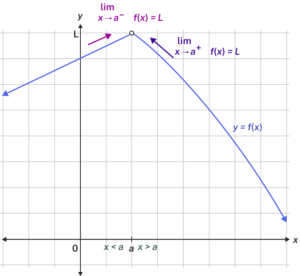
To visually determine if a limit exists as [latex]x[/latex] approaches [latex]a[/latex], we observe the graph of the function when [latex]x[/latex] is very near to [latex]x=a[/latex]. We observe the behavior of the graph on both sides of [latex]a[/latex].
To determine if a left-hand limit exists, we observe the branch of the graph to the left of [latex]x=a[/latex], but near [latex]x=a[/latex]. This is where [latex]xa[/latex]. We see that the outputs are getting close to some real number [latex]L[/latex], so there is a right-hand limit.
If the left-hand limit and the right-hand limit are the same, then we know that the function has a two-sided limit. Normally, when we refer to a “limit,” we mean a two-sided limit, unless we call it a one-sided limit.
Finally, we can look for an output value for the function [latex]f\left(x\right)[/latex] when the input value [latex]x[/latex] is equal to [latex]a[/latex]. The coordinate pair of the point would be [latex]\left(a,f\left(a\right)\right)[/latex]. If such a point exists, then [latex]f\left(a\right)[/latex] has a value. If the point does not exist, then we say that [latex]f\left(a\right)[/latex] does not exist.
How To: Given a function [latex]f\left(x\right)[/latex], use a graph to find the limits and a function value as [latex]x[/latex] approaches [latex]a[/latex].
Examine the graph to determine whether a left-hand limit exists.
Examine the graph to determine whether a right-hand limit exists.
If the two one-sided limits exist and are equal, then there is a two-sided limit—what we normally call a “limit.”
If there is a point at [latex]x=a[/latex], then [latex]f\left(a\right)[/latex] is the corresponding function value.
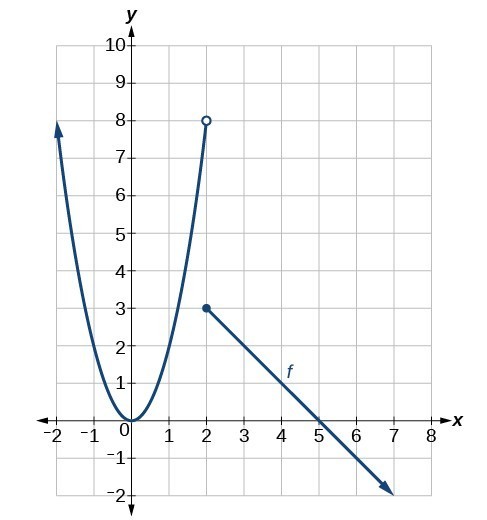
[latex]\underset{x\to {2}^{-}}{\mathrm{lim}}f\left(x\right)=8[/latex]; when [latex]x<2[/latex], but infinitesimally close to 2, the output values get close to [latex]y=8[/latex].
[latex]\underset{x\to 2{}^{+}}{\mathrm{lim}}f\left(x\right)=3[/latex]; when [latex]x>2[/latex], but infinitesimally close to 2, the output values approach [latex]y=3[/latex].
[latex]\underset{x\to 2}{\mathrm{lim}}f\left(x\right)[/latex] does not exist because [latex]\underset{x\to 2{}^{-}}{\mathrm{lim}}f\left(x\right)\ne \underset{x\to 2{}^{+}}{\mathrm{lim}}f\left(x\right)[/latex]; the left and right-hand limits are not equal.
[latex]f\left(2\right)=3[/latex] because the graph of the function [latex]f[/latex] passes through the point [latex]\left(2,f\left(2\right)\right)[/latex] or [latex]\left(2,3\right)[/latex].
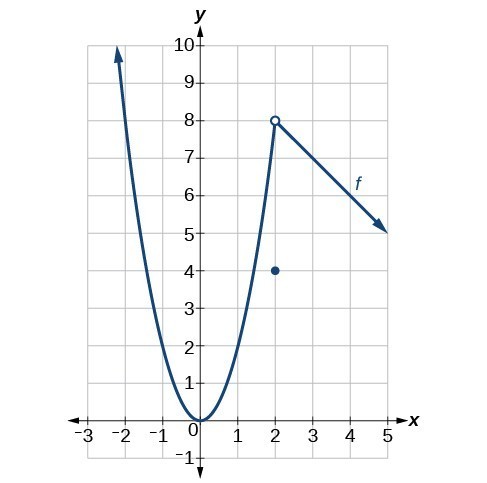
[latex]\underset{x\to 2{}^{-}}{\mathrm{lim}}f\left(x\right)=8[/latex]; when [latex]x<2[/latex] but infinitesimally close to 2, the output values approach [latex]y=8[/latex].
[latex]\underset{x\to 2{}^{+}}{\mathrm{lim}}f\left(x\right)=8[/latex]; when [latex]x>2[/latex] but infinitesimally close to 2, the output values approach [latex]y=8[/latex].
[latex]\underset{x\to 2}{\mathrm{lim}}f\left(x\right)=8[/latex] because [latex]\underset{x\to 2{}^{-}}{\mathrm{lim}}f\left(x\right)=\underset{x\to 2{}^{+}}{\mathrm{lim}}f\left(x\right)=8[/latex]; the left and right-hand limits are equal.
[latex]f\left(2\right)=4[/latex] because the graph of the function [latex]f[/latex] passes through the point [latex]\left(2,f\left(2\right)\right)[/latex] or [latex]\left(2,4\right)[/latex].
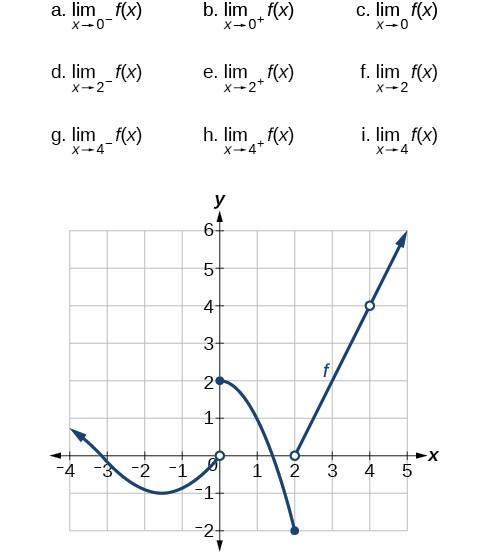
Using the graph of the function [latex]y=f\left(x\right)[/latex], estimate the following limits.
a. 0; b. 2; c. does not exist; d. [latex]-2[/latex]; e. 0; f. does not exist; g. 4; h. 4; i. 4