- Find a limit using a graph
- Find a limit using a table
Find a Limit Using a Graph
The Main IdeaA limit describes what value a function approaches as the input (x) gets closer to some point. Graphs give a visual way to estimate limits. You check how the function behaves from both the left side and the right side of the point of interest. If both sides approach the same y-value, that’s the limit.
Quick Tips: Using Graphs to Find Limits
- Locate the Point of Interest
- Identify the x-value you’re approaching, say [latex]x=a[/latex]
- Check from the Left ([latex]x \to a^{-}[/latex])
- Trace along the curve from values smaller than [latex]a[/latex]
- See what y-value the graph is approaching
- Check from the Right ([latex]x \to a^{+}[/latex])
- Trace from values larger than [latex]a[/latex]
- See what y-value the graph is approaching
- Compare the Two Sides
- If left-hand and right-hand values match, the limit exists and equals that y-value
- If they don’t match, the limit does not exist
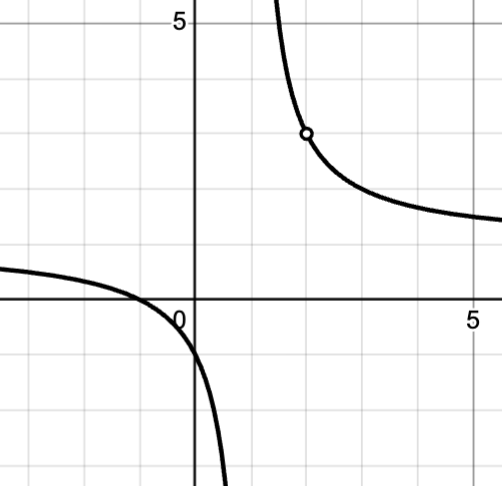
- Special Case: Holes in the Graph
- Even if the function is not defined at [latex]x=a[/latex], the limit can still exist
You can view the transcript for “Ex 2: Determine Limits from a Given Graph” here (opens in new window).
Find a Limit Using a Table
The Main Idea
A limit describes what value a function approaches as [latex]x[/latex] gets closer to some point, even if the function isn’t defined there. A table of values helps approximate limits numerically: plug in values of [latex]x[/latex] near the point from both sides and look at the corresponding [latex]f(x)[/latex] values. If the y-values get closer to the same number from both sides, that number is the limit.
Quick Tips: Using Tables to Find Limits
- Pick the Point of Interest
- Suppose we want [latex]\lim_{x\to a} f(x)[/latex]
- Choose x-Values Close to a
- Select values just smaller than [latex]a[/latex] (left-hand approach)
- Select values just larger than [latex]a[/latex] (right-hand approach)
- Build the Table
- Compute [latex]f(x)[/latex] at each chosen value
- Organize so left-hand and right-hand values are easy to compare
- Look for a Pattern
- If both sides approach the same number, that’s the limit
- If left and right sides don’t match, the limit does not exist