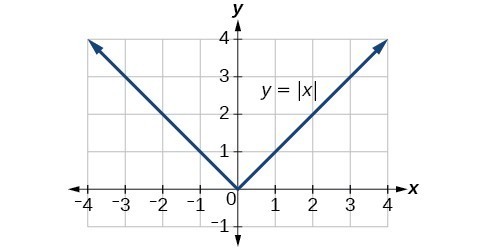
The most significant feature of the absolute value graph is the corner point at which the graph changes direction. This point is shown at the origin.
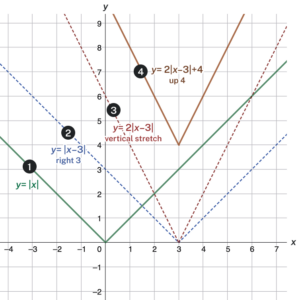
The graph of [latex]y=2\left|x - 3\right|+4[/latex] is an absolute value functions after three transformations. The graph of [latex]y=|x|[/latex] has been shifted right 3 units resulting in [latex]f(x)=\left|x-3\right|[/latex], then vertically stretched by a factor of 2 ([latex]2\left|x-3\right|[/latex]), and shifted up 4 units. This means that the corner point is located at [latex]\left(3,4\right)[/latex] for this transformed function.
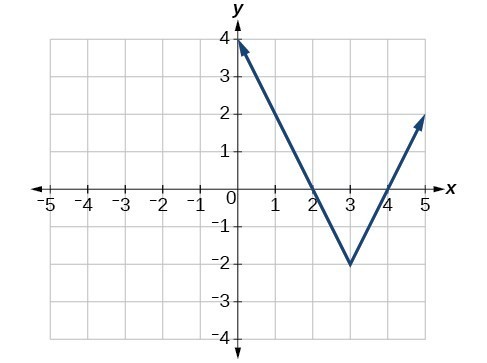
Write an equation for the function graphed.
The basic absolute value function changes direction at the origin, so this graph has been shifted to the right 3 units and down 2 units from the basic toolkit function.
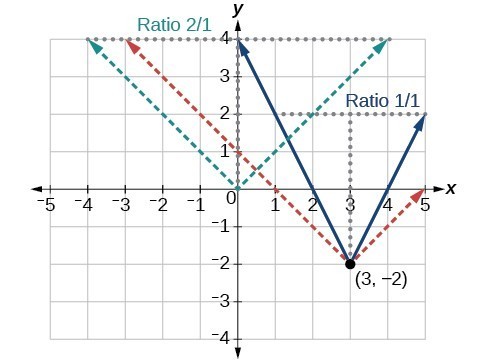
We also notice that the graph appears vertically stretched, because the width of the final graph on a horizontal line is not equal to 2 times the vertical distance from the corner to this line, as it would be for an unstretched absolute value function. Instead, the width is equal to 1 times the vertical distance.
From this information we can write the equation
[latex]\begin{align}&f\left(x\right)=2\left|x - 3\right|-2, && \text{treating the stretch as a vertical stretch,} \\[2mm] \text{or } &f\left(x\right)=\left|2\left(x - 3\right)\right|-2, && \text{treating the stretch as a horizontal compression}. \end{align}[/latex]
Analysis of the Solution
Note that these equations are algebraically equivalent—the stretch for an absolute value function can be written interchangeably as a vertical or horizontal stretch or compression.
If we are unable to determine the stretch based on the width of the graph, we can solve for the stretch factor by putting in a known pair of values for [latex]x[/latex] and [latex]f\left(x\right)[/latex].[latex]f\left(x\right)=a|x - 3|-2[/latex]Now substituting in the point (1, 2)