Graphing Polynomials
Now that you understand end behavior, intercepts, and multiplicity, it’s time to put all these pieces together to sketch polynomial graphs by hand.
How to: Graph Polynomials by Hand
- Determine end behavior using the degree and leading coefficient
- Find all intercepts (x-intercepts and y-intercept)
- Identify multiplicity at each x-intercept
- Plot intercepts and sketch local behavior at each
- Connect with smooth curves respecting end behavior
- Verify with additional points if needed
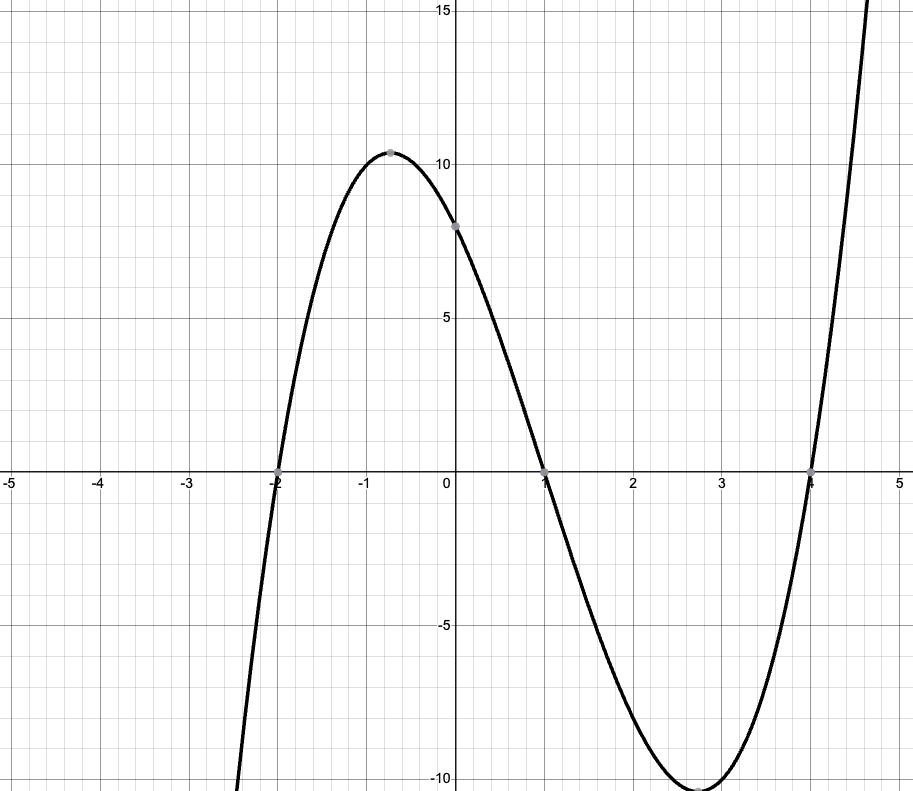
Leading coefficient: 1 (positive)
End behavior: As [latex]x \to -\infty[/latex], [latex]f(x) \to -\infty[/latex] As [latex]x \to +\infty[/latex], [latex]f(x) \to +\infty[/latex]
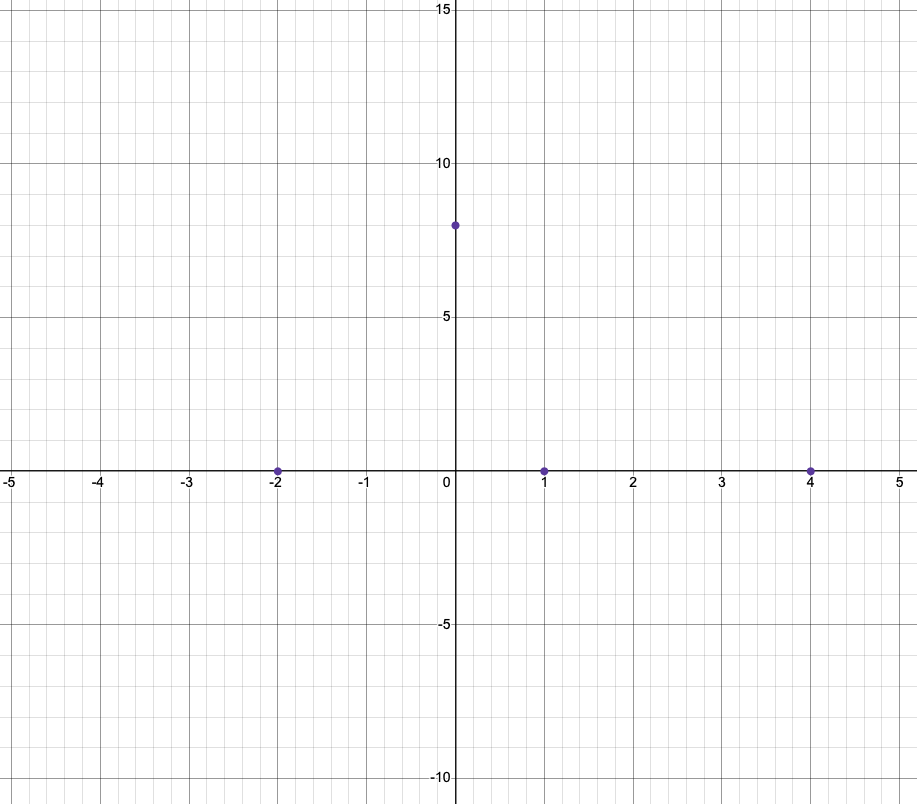
Step 2: Find intercepts
[latex]x[/latex]-intercepts: Set each factor to zero
[latex]x + 2 = 0 \Rightarrow x = -2[/latex]
[latex]x - 1 = 0 \Rightarrow x = 1[/latex]
[latex]x - 4 = 0 \Rightarrow x = 4[/latex]
y-intercept: [latex]f(0) = (0 + 2)(0 - 1)(0 - 4) = (2)(-1)(-4) = 8[/latex]
Intercepts: [latex](-2, 0)[/latex], [latex](1, 0)[/latex], [latex](4, 0)[/latex], and [latex](0, 8)[/latex]
Step 3: Analyze multiplicity
All factors have multiplicity 1, so the graph crosses the x-axis at each intercept.
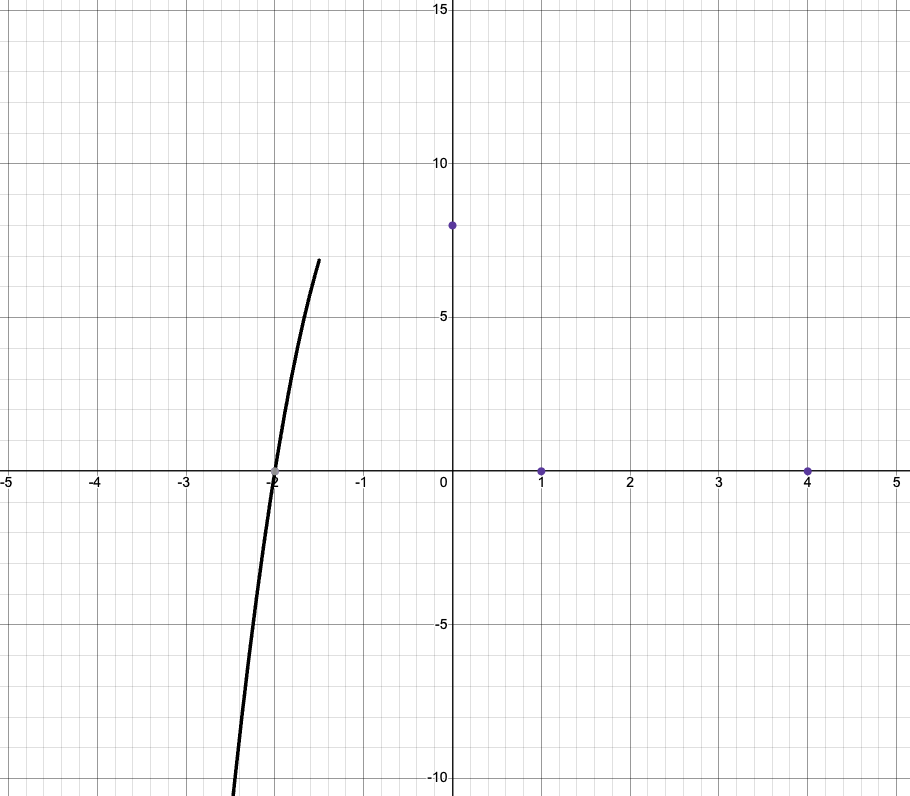
Step 4: Sketch the graph
Plot intercepts: [latex](-2, 0)[/latex], [latex](1, 0)[/latex], [latex](4, 0)[/latex], [latex](0, 8)[/latex]
Start from left: Graph comes from [latex]-\infty[/latex]
Cross at [latex]x = -2[/latex]: Graph goes from negative to positive
Cross at [latex]x = 1[/latex]: Graph goes from positive to negative
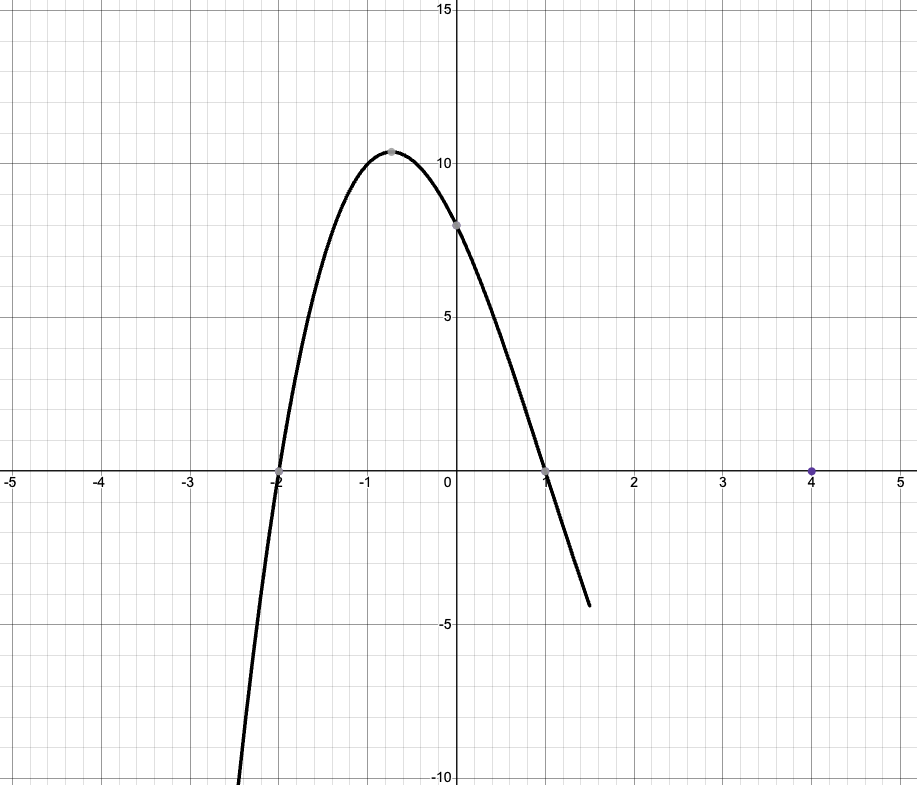
Cross at [latex]x = 4[/latex]: Graph goes from negative to positive
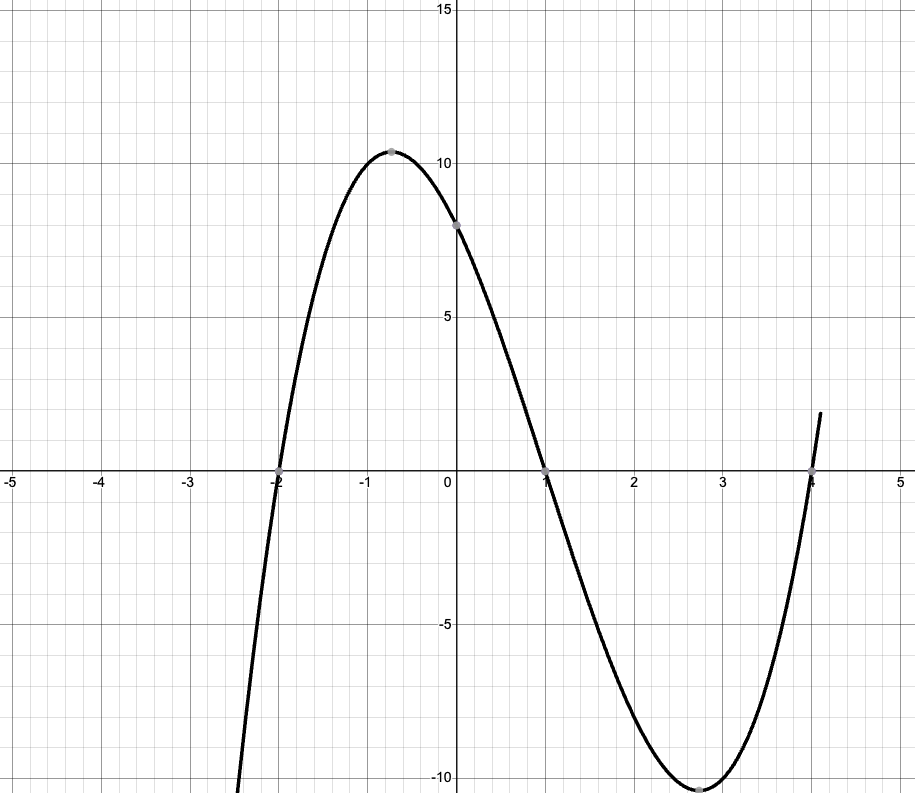
End on right: Graph goes to [latex]+\infty[/latex]