- Utilize arrow notation to specify the behavior of rational functions.
- Find the domains of rational functions.
- Identify vertical and horizontal asymptotes.
- Identify slant asymptotes.
- Graph rational functions.
Rational Functions
A rational function is a function that can be written as the quotient of two polynomial functions [latex]P\left(x\right) \text{ and } Q\left(x\right)[/latex].
[latex]f\left(x\right)=\dfrac{P\left(x\right)}{Q\left(x\right)}=\dfrac{{a}_{p}{x}^{p}+{a}_{p - 1}{x}^{p - 1}+...+{a}_{1}x+{a}_{0}}{{b}_{q}{x}^{q}+{b}_{q - 1}{x}^{q - 1}+...+{b}_{1}x+{b}_{0}},Q\left(x\right)\ne 0[/latex]
When a variable is present in the denominator of a rational expression, certain values of the variable may cause the denominator to equal zero. A rational expression with a zero in the denominator is not defined since we cannot divide by zero.
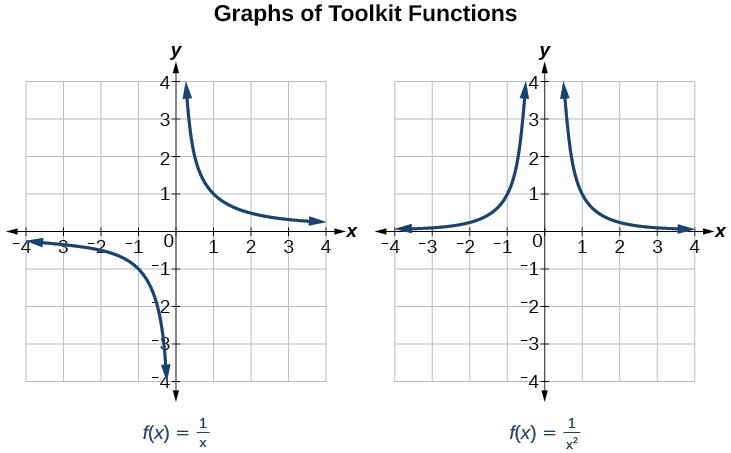 Several things are apparent if we examine the graph of [latex]f\left(x\right)=\dfrac{1}{x}[/latex].
- On the left branch of the graph, the curve approaches the [latex]x[/latex]-axis [latex]\left(y=0\right) \text{ as } x\to -\infty[/latex].
- As the graph approaches [latex]x=0[/latex] from the left, the curve drops, but as we approach zero from the right, the curve rises.
- Finally, on the right branch of the graph, the curves approaches the [latex]x[/latex]–axis [latex]\left(y=0\right) \text{ as } x\to \infty[/latex].
Arrow Notations
We use arrow notation to show that [latex]x[/latex] or [latex]f\left(x\right)[/latex] is approaching a particular value.
| Arrow Notation | |
|---|---|
| Symbol | Meaning |
| [latex]x\to {a}^{-}[/latex] | [latex]x[/latex] approaches [latex]a[/latex] from the left ([latex]x \lt a[/latex] but close to [latex]a[/latex]) |
| [latex]x\to {a}^{+}[/latex] | [latex]x[/latex] approaches [latex]a[/latex] from the right ([latex]x \lt a[/latex] but close to [latex]a[/latex]) |
| [latex]x\to \infty[/latex] | [latex]x[/latex] approaches infinity ([latex]x[/latex] increases without bound) |
| [latex]x\to -\infty[/latex] | [latex]x[/latex] approaches negative infinity ([latex]x[/latex] decreases without bound) |
| [latex]f\left(x\right)\to \infty[/latex] | the output approaches infinity (the output increases without bound) |
| [latex]f\left(x\right)\to -\infty[/latex] | the output approaches negative infinity (the output decreases without bound) |
| [latex]f\left(x\right)\to a[/latex] | the output approaches [latex]a[/latex] |
| [latex]x[/latex] | [latex]–0.1[/latex] | [latex]–0.01[/latex] | [latex]–0.001[/latex] | [latex]–0.0001[/latex] |
| [latex]f\left(x\right)=\frac{1}{x}[/latex] | [latex]–10[/latex] | [latex]–100[/latex] | [latex]–1000[/latex] | [latex]–10,000[/latex] |
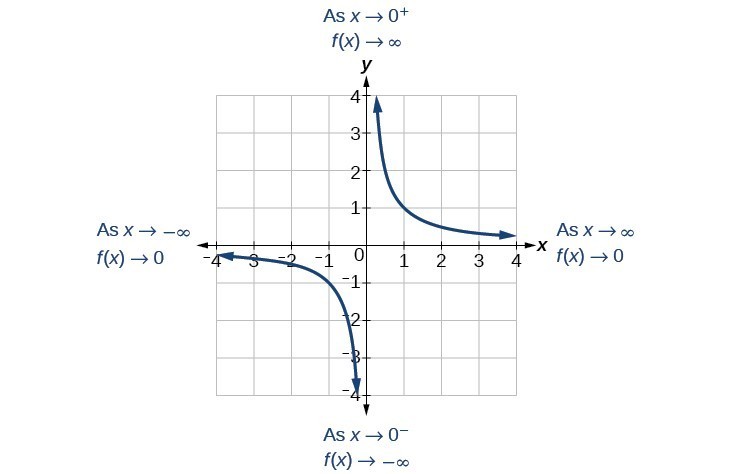
We write in arrow notation:
[latex]\text{as }x\to {0}^{-},f\left(x\right)\to -\infty[/latex]
As [latex]x[/latex] approaches [latex]0[/latex] from the left (negative) side, [latex]f(x)[/latex] will approach negative infinity.
As the input values approach zero from the right side (becoming very small, positive values), the function values increase without bound (approaching infinity). We can see this behavior in the table below.
| [latex]x[/latex] | [latex]0.1[/latex] | [latex]0.01[/latex] | [latex]0.001[/latex] | [latex]0.0001[/latex] |
| [latex]f\left(x\right)=\frac{1}{x}[/latex] | [latex]10[/latex] | [latex]100[/latex] | [latex]1000[/latex] | [latex]10,000[/latex] |
We write in arrow notation:
[latex]\text{As }x\to {0}^{+}, f\left(x\right)\to \infty[/latex].
As [latex]x[/latex] approaches [latex]0[/latex] from the right (positive) side, [latex]f(x)[/latex] will approach infinity.
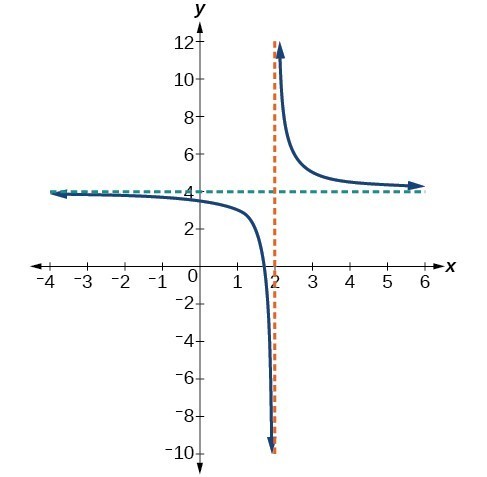
- As [latex]x \to -1^-[/latex]
- As [latex]x \to -1^+[/latex]
- As [latex]x \to -\infty[/latex]
- As [latex]x \to \infty[/latex]