Graphing a Linear Function Using [latex]y[/latex]-intercept and Slope
Another way to graph linear functions is by using specific characteristics of the function rather than plotting points. The first characteristic is its [latex]y[/latex]–intercept which is the point at which the input value is zero. To find the [latex]y[/latex]–intercept, we can set [latex]x=0[/latex] in the equation. The other characteristic of the linear function is its slope [latex]m[/latex].
[latex]f\left(x\right)=\frac{1}{2}x+1[/latex]
- The slope is [latex]\frac{1}{2}[/latex]. Because the slope is positive, we know the graph will slant upward from left to right.
- The [latex]y[/latex]–intercept is the point on the graph when [latex]x = 0[/latex]. The graph crosses the [latex]y[/latex]-axis at [latex](0, 1)[/latex].
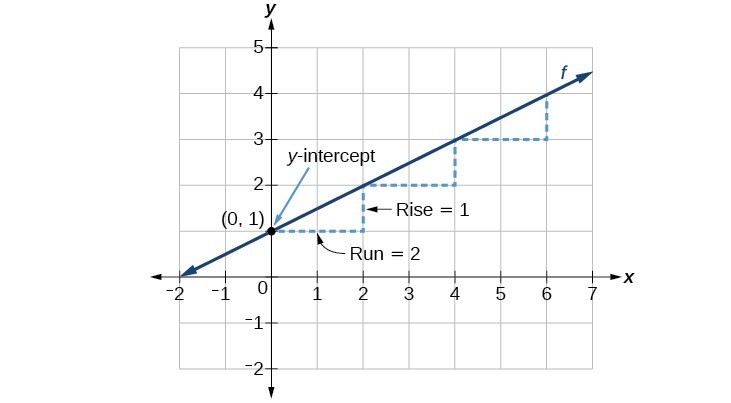
Now we know the slope and the [latex]y[/latex]-intercept. We can begin graphing by plotting the point [latex](0, 1)[/latex] We know that the slope is rise over run, [latex]m=\frac{\text{rise}}{\text{run}}[/latex].
From our example, we have [latex]m=\frac{1}{2}[/latex], which means that the rise is [latex]1[/latex] and the run is [latex]2[/latex]. Starting from our [latex]y[/latex]-intercept [latex](0, 1)[/latex], we can rise [latex]1[/latex] and then run [latex]2[/latex] or run [latex]2[/latex] and then rise [latex]1[/latex]. We repeat until we have multiple points, and then we draw a line through the points as shown below.
graphical interpretation of a linear function
In the equation [latex]f\left(x\right)=mx+b[/latex]
- [latex]b[/latex] is the [latex]y[/latex]-intercept of the graph and indicates the point [latex](0, b)[/latex] at which the graph crosses the [latex]y[/latex]-axis.
- [latex]m[/latex] is the slope of the line and indicates the vertical displacement (rise) and horizontal displacement (run) between each successive pair of points. Recall the formula for the slope:
[latex]m=\frac{\text{change in output (rise)}}{\text{change in input (run)}}=\frac{\Delta y}{\Delta x}=\frac{{y}_{2}-{y}_{1}}{{x}_{2}-{x}_{1}}[/latex]
- Evaluate the function at an input value of zero to find the [latex]y[/latex]–intercept.
- Identify the slope.
- Plot the point represented by the y-intercept.
- Use [latex]\frac{\text{rise}}{\text{run}}[/latex] to determine at least two more points on the line.
- Draw a line which passes through the points.

https://www.geogebra.org/graphing
https://www.desmos.com/calculator
https://www.symbolab.com/graphing-calculator
Try it now
These graphing utilities have features that allow you to turn a constant (number) into a variable. Follow these steps to learn how:
- Graph the line [latex]y=-\frac{2}{3}x-\frac{4}{3}[/latex].
- On the next line enter [latex]y=-a x-\frac{4}{3}[/latex]. You will see a button pop up that says “add slider: a”, click on the button. You will see the next line populated with the variable a and the interval on which a can take values.
- What part of a line does the variable a represent? The slope or the y-intercept?