Graphing a Linear Function Using [latex]y[/latex]-intercept and Slope
We can graph linear functions by using specific characteristics of the function rather than plotting points. The first characteristic is its [latex]y[/latex]–intercept which is the point at which the input value is zero. To find the [latex]y[/latex]–intercept, we can set [latex]x=0[/latex] in the equation. The other characteristic of the linear function is its slope [latex]m[/latex].
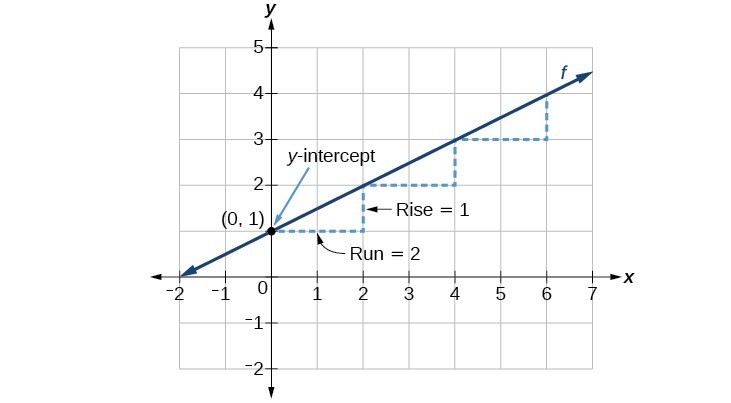
[latex]f\left(x\right)=\frac{1}{2}x+1[/latex]
- The slope is [latex]\frac{1}{2}[/latex]. Because the slope is positive, we know the graph will slant upward from left to right.
- The [latex]y[/latex]–intercept is the point on the graph when [latex]x = 0[/latex]. The graph crosses the [latex]y[/latex]-axis at [latex](0, 1)[/latex].
Now we know the slope and the [latex]y[/latex]-intercept. We can begin graphing by plotting the point [latex](0, 1)[/latex] We know that the slope is rise over run, [latex]m=\frac{\text{rise}}{\text{run}}[/latex].
From our example, we have [latex]m=\frac{1}{2}[/latex], which means that the rise is [latex]1[/latex] and the run is [latex]2[/latex]. Starting from our [latex]y[/latex]-intercept [latex](0, 1)[/latex], we can rise [latex]1[/latex] and then run [latex]2[/latex] or run [latex]2[/latex] and then rise [latex]1[/latex]. We repeat until we have multiple points, and then we draw a line through the points as shown below.
graphical interpretation of a linear function
In the equation [latex]f\left(x\right)=mx+b[/latex]
- [latex]b[/latex] is the [latex]y[/latex]-intercept of the graph and indicates the point [latex](0, b)[/latex] at which the graph crosses the [latex]y[/latex]-axis.
- [latex]m[/latex] is the slope of the line and indicates the vertical displacement (rise) and horizontal displacement (run) between each successive pair of points. Recall the formula for the slope:
[latex]m=\frac{\text{change in output (rise)}}{\text{change in input (run)}}=\frac{\Delta y}{\Delta x}=\frac{{y}_{2}-{y}_{1}}{{x}_{2}-{x}_{1}}[/latex]
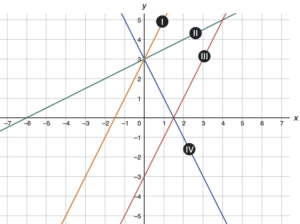
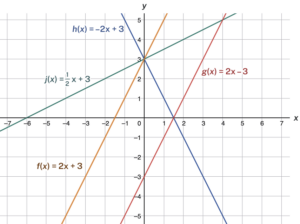
Match each equation of the linear functions with one of the lines on the graph.
- [latex]f\left(x\right)=2x+3[/latex]
- [latex]g\left(x\right)=2x - 3[/latex]
- [latex]h\left(x\right)=-2x+3[/latex]
- [latex]j\left(x\right)=\frac{1}{2}x+3[/latex]
- Evaluate the function at an input value of zero to find the [latex]y[/latex]–intercept.
- Identify the slope.
- Plot the point represented by the y-intercept.
- Use [latex]\frac{\text{rise}}{\text{run}}[/latex] to determine at least two more points on the line.
- Draw a line which passes through the points.

Look at the graph of the function [latex]f[/latex] given below:
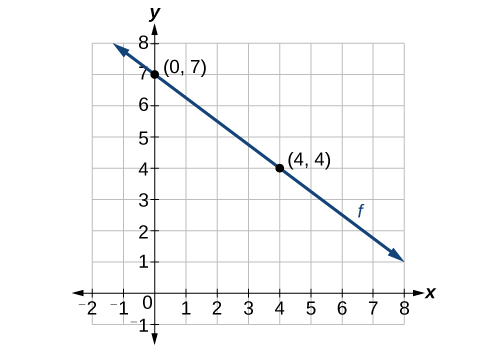
We are not given the slope of the line, but we can choose any two points on the line to find the slope. Let’s choose [latex](0, 7)[/latex] and [latex](4, 4)[/latex].
[latex]\begin{array}{rcl} m & = & \frac{y_2 - y_1}{x_2 - x_1} \\ m & = & \frac{4 - 7}{4 - 0} \\ m & = & -\frac{3}{4} \end{array}[/latex]
Now we can substitute the slope and the coordinates of one of the points into the point-slope form.
[latex]\begin{array}{rcl} y - y_1 & = & m(x - x_1) \\ y - 4 & = & -\frac{3}{4}(x - 4) \end{array}[/latex]
If we want to rewrite the equation in the slope-intercept form, we would find
[latex]\begin{array}{rcl} y - 4 & = & -\frac{3}{4}(x - 4) \\ y - 4 & = & -\frac{3}{4}x + 3 \\ y & = & -\frac{3}{4}x + 7 \end{array}[/latex]
If we want to find the slope-intercept form without first writing the point-slope form, we could have recognized that the line crosses the y-axis when the output value is 7. Therefore, [latex]b = 7[/latex]. We now have the initial value [latex]b[/latex] and the slope [latex]m[/latex], so we can substitute [latex]m[/latex] and [latex]b[/latex] into the slope-intercept form of a line.
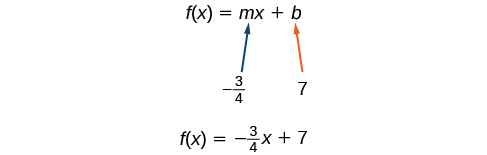
So the function is [latex]f(x) = -\frac{3}{4}x + 7[/latex], and the linear equation would be [latex]y = -\frac{3}{4}x + 7[/latex].
How to: Given the graph of a linear function, write an equation to represent the function.
- Identify two points on the line.
- Use the two points to calculate the slope.
- Determine where the line crosses the y-axis to identify the y-intercept by visual inspection.
- Substitute the slope and y-intercept into the slope-intercept form of a line equation.