Local and Absolute Extrema
local minima and local maxima (extrema)
- A function [latex]f[/latex] is an increasing function on an open interval if [latex]f\left(b\right) > f\left(a\right)[/latex] for any two input values [latex]a[/latex] and [latex]b[/latex] in the given interval where [latex]b > a[/latex].
- A function [latex]f[/latex] is a decreasing function on an open interval if [latex]f\left(b\right) < f\left(a\right)[/latex] for any two input values [latex]a[/latex] and [latex]b[/latex] in the given interval where [latex]b > a[/latex].
- A function [latex]f[/latex] has a local maximum at [latex]x=b[/latex] if there exists an interval [latex]\left(a,c\right)[/latex] with [latex]a < b < c[/latex] such that, for any [latex]x[/latex] in the interval [latex]\left(a,c\right)[/latex], [latex]f\left(x\right)\le f\left(b\right)[/latex].
- Likewise, [latex]f[/latex] has a local minimum at [latex]x=b[/latex] if there exists an interval [latex]\left(a,c\right)[/latex] with [latex]a < b < c[/latex] such that, for any [latex]x[/latex] in the interval [latex]\left(a,c\right)[/latex], [latex]f\left(x\right)\ge f\left(b\right)[/latex].
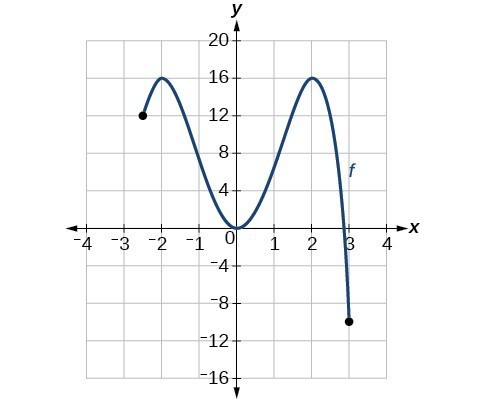
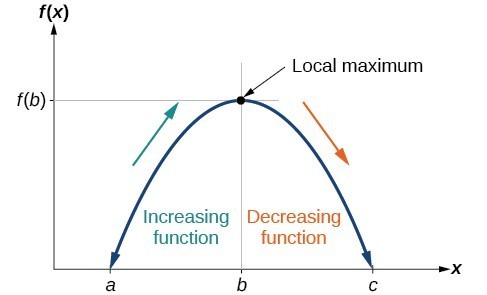
To locate the local maxima and minima from a graph, we need to observe the graph to determine where the graph attains its highest and lowest points, respectively, within an open interval. Like the summit of a roller coaster, the graph of a function is higher at a local maximum than at nearby points on both sides. The graph will also be lower at a local minimum than at neighboring points. The graph below illustrates these ideas for a local maximum.
 Analysis of the Solution[latex]\\[/latex]Most graphing calculators and graphing utilities can estimate the location of maxima and minima. The graph below provides screen images from two different technologies, showing the estimate for the local maximum and minimum.
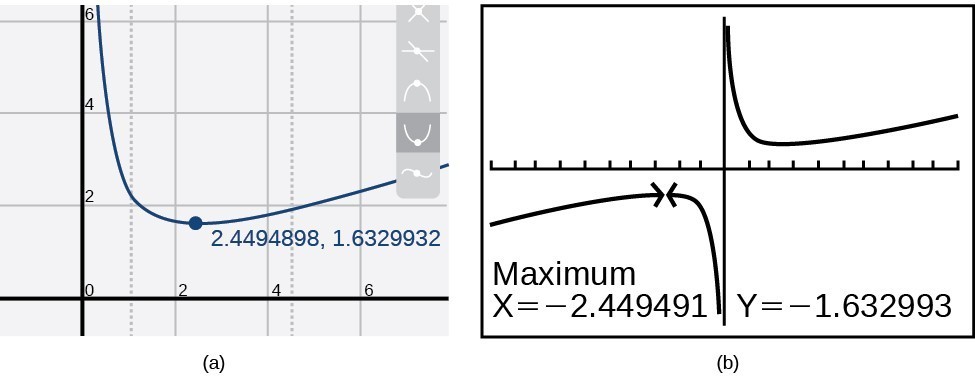 Based on these estimates, the function is increasing on the interval [latex]\left(-\infty ,-{2.449}\right)[/latex] and [latex]\left(2.449\text{,}\infty \right)[/latex]. Notice that, while we expect the extrema to be symmetric, the two different technologies agree only up to four decimals due to the differing approximation algorithms used by each. (The exact locations of the extrema are at [latex]\pm \sqrt{6}[/latex], but determining this requires calculus.)
[latex]\left(\text{input, output}\right) \quad = \quad \left(x, f(x)\right)[/latex].
If a function’s graph has a local minimum or maximum at some point [latex]\left(x, f(x)\right)[/latex], we say
“the extrema occurs at [latex]x[/latex], and that the minimum or maximum is [latex]f(x)[/latex].”

Use A Graph to Locate the Absolute Maximum and Absolute Minimum
There is a difference between locating the highest and lowest points on a graph in a region around an open interval (locally) and locating the highest and lowest points on the graph for the entire domain. The [latex]y\text{-}[/latex] coordinates (output) at the highest and lowest points are called the absolute maximum and absolute minimum, respectively.
To locate absolute maxima and minima from a graph, we need to observe the graph to determine where the graph attains it highest and lowest points on the domain of the function.
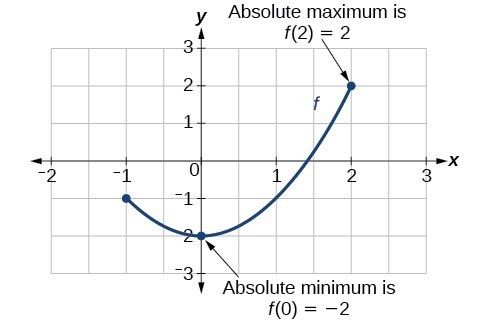
absolute maxima and minima
- The absolute maximum of [latex]f[/latex] at [latex]x=c[/latex] is [latex]f\left(c\right)[/latex] where [latex]f\left(c\right)\ge f\left(x\right)[/latex] for all [latex]x[/latex] in the domain of [latex]f[/latex].
- The absolute minimum of [latex]f[/latex] at [latex]x=d[/latex] is [latex]f\left(d\right)[/latex] where [latex]f\left(d\right)\le f\left(x\right)[/latex] for all [latex]x[/latex] in the domain of [latex]f[/latex].