- Graph exponential functions.
- Graph exponential functions using transformations.
Bacterial Growth in Food Safety
Dr. Martinez works as a food safety inspector for a restaurant chain. She needs to understand how bacteria multiply in food left at room temperature to determine safe storage times and create effective food safety protocols.
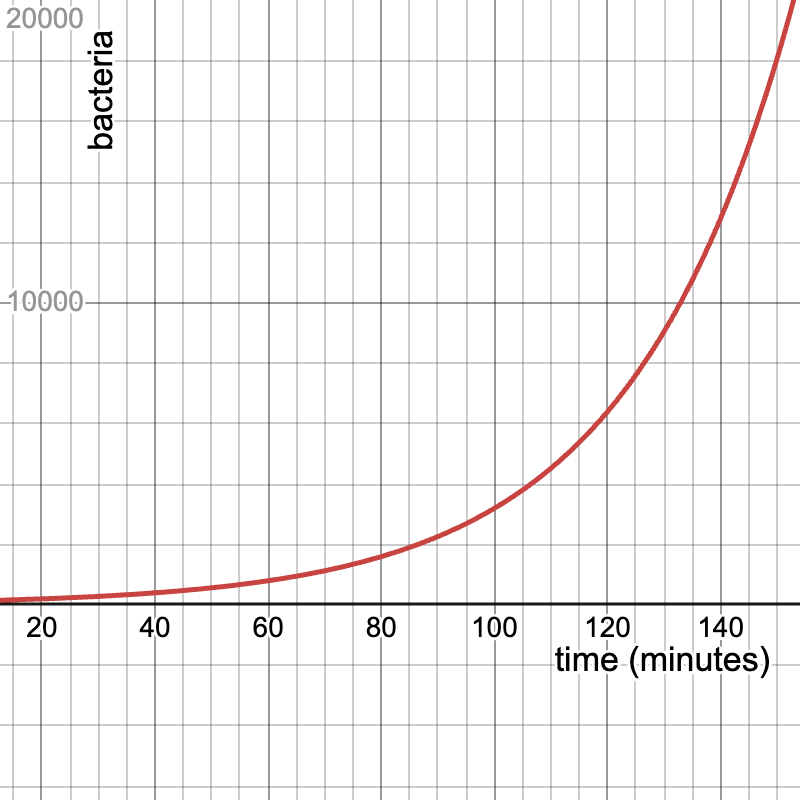
When food is left at room temperature (70°F), certain harmful bacteria can double every 20 minutes. Starting with an initial population of 100 bacteria, Dr. Martinez needs to graph this growth pattern, modeled by [latex]f(t)=100(2)^{\frac{t}{20}}[/latex] where [latex]t[/latex] represents the time in minutes, and use it to make critical food safety decisions.
Graph the bacterial growth modeled by [latex]f(t)=100(2)^{\frac{t}{20}}[/latex].
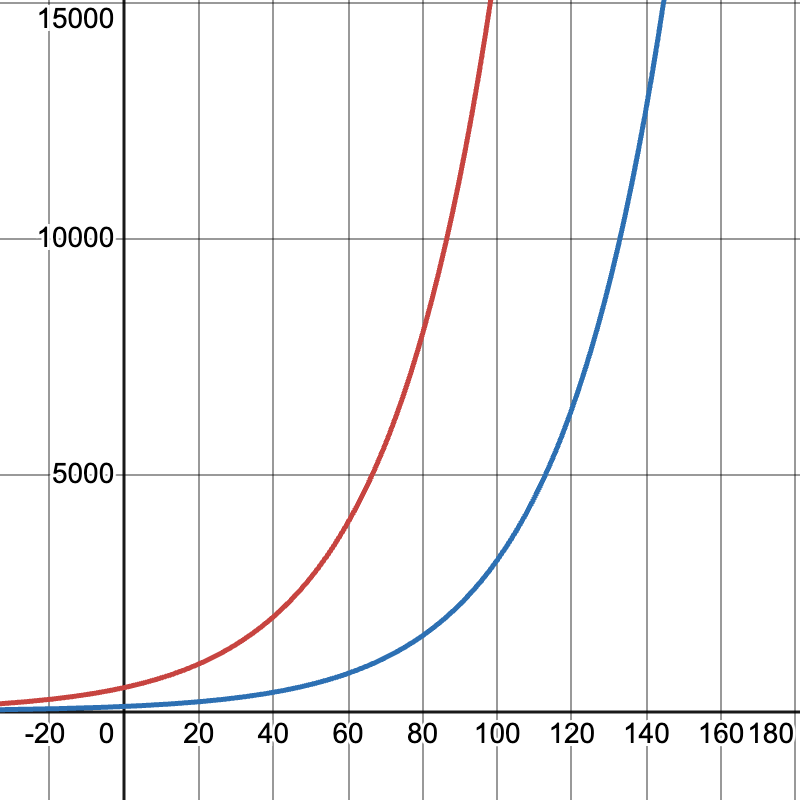
Dr. Martinez finds that some foods start with higher baseline contamination. Deli meats might begin with 500 bacteria instead of 100.
The new model becomes: [latex]P_2(t) = 500 \cdot 2^{\frac{t}{20}}[/latex].
Graph the new model and compare it to the original.