- Determine amplitude, period, phase shift, and vertical shift of a sine or cosine graph from its equation.
- Graph transformations of y=cos x and y=sin x .
- Determine a function formula that would have a given sinusoidal graph.
- Determine functions that model circular and periodic motion.
The Standard Graph of [latex]y=sin(x)[/latex] and [latex]y=cos(x)[/latex]
So what do they look like on a graph on a coordinate plane?
| x | 0 | [latex]\frac{\pi}{6}[/latex] | [latex]\frac{\pi}{4}[/latex] | [latex]\frac{\pi}{3}[/latex] | [latex]\frac{\pi}{2}[/latex] | [latex]\frac{2\pi}{3}[/latex] | [latex]\frac{3\pi}{4}[/latex] | [latex]\frac{5\pi}{6}[/latex] | [latex]\pi[/latex] |
| [latex]\sin(x)[/latex] | 0 | [latex]\frac{1}{2}[/latex] | [latex]\frac{\sqrt{2}}{2}[/latex] | [latex]\frac{\sqrt{3}}{2}[/latex] | 1 | [latex]\frac{\sqrt{3}}{2}[/latex] | [latex]\frac{\sqrt{2}}{2}[/latex] | [latex]\frac{1}{2}[/latex] | 0 |
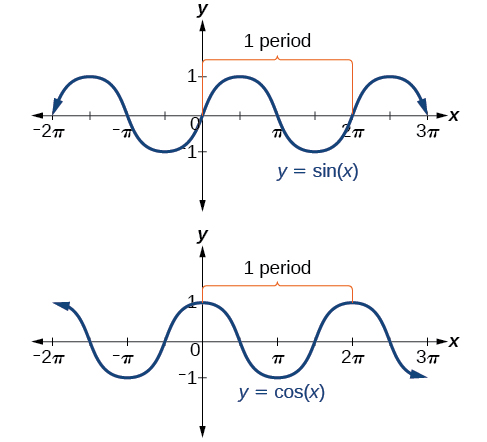
Plotting the points from the table and continuing along the x-axis gives the shape of the sine function.

Notice how the sine values are positive between 0 and π, which correspond to the values of the sine function in quadrants I and II on the unit circle, and the sine values are negative between π and 2π, which correspond to the values of the sine function in quadrants III and IV on the unit circle.

Now let’s take a similar look at the cosine function.
| x | 0 | [latex]\frac{\pi}{6}[/latex] | [latex]\frac{\pi}{4}[/latex] | [latex]\frac{\pi}{3}[/latex] | [latex]\frac{\pi}{2}[/latex] | [latex]\frac{2\pi}{3}[/latex] | [latex]\frac{3\pi}{4}[/latex] | [latex]\frac{5\pi}{6}[/latex] | [latex]\pi[/latex] |
| [latex]\cos(x)[/latex] | 1 | [latex]\frac{\sqrt{3}}{2}[/latex] | [latex]\frac{\sqrt{2}}{2}[/latex] | [latex]\frac{1}{2}[/latex] | 0 | [latex]-\frac{1}{2}[/latex] | [latex]-\frac{\sqrt{2}}{2}[/latex] | [latex]-\frac{\sqrt{3}}{2}[/latex] | −1 |
As with the sine function, we can plots points to create a graph of the cosine function.

Because we can evaluate the sine and cosine of any real number, both of these functions are defined for all real numbers. By thinking of the sine and cosine values as coordinates of points on a unit circle, it becomes clear that the range of both functions must be the interval [−1,1].
In both graphs, the shape of the graph repeats after [latex]2\pi[/latex], which means the functions are periodic with a period of [latex]2pi[/latex].
period of a function
The period of a trigonometric function is the length of one complete cycle of the function’s graph
Symmetry of Sine and Cosine
Now we can clearly see this property from the graph.

The cosine function is symmetric about the y-axis. Again, we determined that the cosine function is an even function. Now we can see from the graph that [latex]\cos(−x)=\cos x[/latex].

characteristics of sine and cosine graphs
The sine and cosine functions have several distinct characteristics:
- They are periodic functions with a period of 2π.
- The domain of each function is [latex]\left(-\infty,\infty\right)[/latex] and the range is [latex]\left[−1,1\right][/latex].
- The graph of [latex]y=\sin x[/latex] is symmetric about the origin, because it is an odd function.
- The graph of [latex]y=\cos x[/latex] is symmetric about the y-axis, because it is an even function.