Learn It 5.3.5 Choosing and Using Graphics

Title Your Graphic

Most of the time, putting the data into graph form isn’t quite enough. In fact, it’s just the start. You created this graph to help you tell the story of your data and to ensure your message gets across, you need to be clever about the titles you include.

You’ll find most communicators title their graphs according to the content they display. It might say “Year-over-year Performance” or “Weekly Average Ticket Sales.” But if your message is about how weekly average ticket sales are down 10 percent compared to last year, you might consider calling your graph “Average Ticket Sales are Decreasing.”

The video below is a demonstration of how to make a graph tell your story by making it easier to read and making the title active:

You can view the transcript for “Persuasive Presentation: How to Make Graphs More Powerful” here (opens in new window).

Captions for Your Graphic

Captions usually indicate the source of information. If your sources and communications are not produced by people within your company, then this is an important step. Captioning the source gives your information credibility and strengthens your story. It also gives credit to the producers of the work.

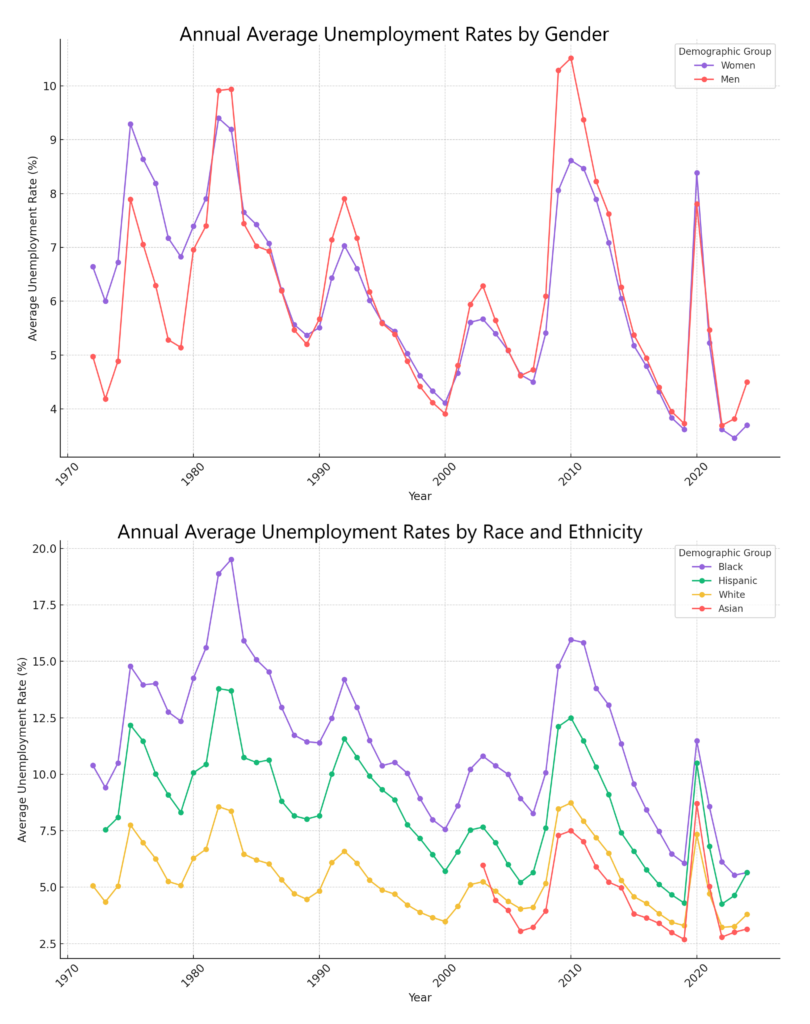
You can also use captions to convey other pertinent information such as the variables being plotted, the units of measurement, or any relevant context. You may want to include the sample size of a survey the graph is illustrating or additional background information about the data (as shown in Figure 1). Using captions in this manner helps the reader draw the conclusion that you intend.

The first graph illustrates the trends in unemployment rates by gender from 1972 to 2024. In 1972, the unemployment rate for females started at approximately 6.6%. It peaked at about 9.3% in 1975, then decreased until spiking again to 8.1% in 2009 during the economic recession. By 2014, the rate had decreased to 6.1% for females, and it continued to decline to 3.7% by 2024. For males, the rate commenced at around 5% in 1972, fluctuated over the years, and was at 6.3% in 2014, dropping further to 4.5% by 2024. The second graph shows the trends in unemployment rates by race and ethnicity from 1972 to 2024. For the Black demographic, the unemployment rate in 1972 was 10.4%, surged to nearly 15% in 1975, climbed to 19.5% in 1983, and was around 11.4% in 2014, before dropping to 5.65% by 2024. The rate for Hispanics (with data available from 1973 onwards) saw a rise to around 12.2% in 1975 and was 7.4% in 2014, further decreasing to 5.65% by 2024. The unemployment rate for Whites started at approximately 5% in 1972, jumped to nearly 8% in 1975, reached around 8.6% in 1982, and was at 5.3% in 2014, declining to 3.8% by 2024. Beginning with data in 2000, the unemployment rate for Asians was relatively lower compared to other demographics, with fluctuations over the years. By 2014, it was approximately 4.8%, and by 2024, it had decreased to around 2.5%.
Figure 1. Unemployment Rate by Demographic Group. (a) By gender, 1972–2024. Unemployment rates for men used to be lower than unemployment rates for women, but in recent decades, the two rates have been very close, often—and especially during and soon after the Great Recession—with the unemployment rate for men somewhat higher. (b) By race and ethnicity, 1972–2024. Although unemployment rates for all groups tend to rise and fall together, the unemployment rate for Black people is typically about twice as high as that for White people, while the unemployment rate for Hispanic people is in between. The unemployment rates for Asian people are similar to that of White people. (Source: www.bls.gov)

A caption on a graph can be ineffective when there is more information captioned than is of interest to your audience, or if information included in the caption would be better displayed elsewhere.

Visual media should always make a point clearer, so make sure your graph’s format, titles, and captions are working for you rather than against you.