Investing Cont.
Basic Forms of Investments Cont.
Stocks
Stocks are part ownership in a company. They come in units called shares. The performance and earnings of stocks is not guaranteed, which makes them riskier than any other investment discussed earlier. However, they can offer higher return on investment than the other investments.
stocks
Stocks are investments that grant ownership shares in a corporation, potentially enabling investors to share in a company’s success through increases in the stock’s price and dividends.
Stocks value grows in two ways. They offer dividends, which is a portion of the profit made by the company. And the price per share can increase based on how others see that value of the company changing. If the value of the company drops, or the company folds, the money invested in the stock also drops.
Most stock transactions are executed through a broker. Brokers’ commissions can be a percentage of value of the trades made or a flat fee. There are full-service brokers who charge higher commission rates, but they also offer financial advice and perform the research that you may not have the time or the expertise to do on your own. A discount broker only executes the stock transactions, buying or selling, so they charge lower rates than full-service brokers. There are also brokers that offer commission-free trading.
An important thing to remember is that stocks might provide a very large return on investment, but the trade-off is the risk associated with owning stocks.
Volkswagen seems to be a rather safe investment. But in 2015, Volkswagen’s stock tumbled [latex]30\%[/latex] over a few days when it was revealed that the company had installed software that altered the emission performance of some of their diesel engines. Volkswagen’s hope was that lower emissions would bolster US sales of some of their diesel models. This was a drastic drop, and many investors lost a lot of money. However, the stock has come back since then. This was mild compared to the [latex]65\%[/latex] drop in the Martha Stewart Living Omnimedia stocks.
Reading Stock Tables
Information about particular stocks is contained in stock tables. This information includes how much the stock is selling for, and its high and low values form the past year ([latex]52[/latex] weeks). A stock table in print may look like this:
| Stock | McDonald’s | Monsanto | Motorola | Mueller |
|---|---|---|---|---|
| SYM | MCD | MON | MOT | MLI |
| 52-Week High | [latex]41.66[/latex] | [latex]22.60[/latex] | [latex]17.05[/latex] | [latex]31.75[/latex] |
| 52-Week Low | [latex]18.90[/latex] | [latex]13.20[/latex] | [latex]8.30[/latex] | [latex]22.99[/latex] |
| Div | [latex].72[/latex] | [latex].52[/latex] | [latex].16[/latex] | – |
| Yld [latex]\%[/latex] | [latex]2.9[/latex] | [latex]2.4[/latex] | [latex]1.7[/latex] | – |
| P/E | [latex]12[/latex] | [latex]55[/latex] | — | [latex]16[/latex] |
| Vol [latex]100[/latex]s | [latex]7588[/latex] | [latex]15474[/latex] | [latex]16149[/latex] | [latex]1564[/latex] |
| High | [latex]25.73[/latex] | [latex]21.86[/latex] | [latex]10.57[/latex] | [latex]29.32[/latex] |
| Low | [latex]23.87[/latex] | [latex]21.48[/latex] | [latex]8.88[/latex] | [latex]27.03[/latex] |
| Close | [latex]25.42[/latex] | [latex]21.64[/latex] | [latex]10.43[/latex] | [latex]27.11[/latex] |
| Net Chg | [latex]+0.31[/latex] | [latex]-0.29[/latex] | [latex]+0.14[/latex] | [latex]-0.02[/latex] |
The symbols and abbreviations are defined here:
| Stock | The name of the company |
| SYM | The symbol used for trading |
| [latex]52[/latex]-week High | The highest price of the stock over the past [latex]52[/latex] weeks |
| [latex]52[/latex]-week Low | The lowest price of the stock over the past [latex]52[/latex] weeks |
| Annual DIV | The current annual dividend per share |
| Yld [latex]\%[/latex] | Percent yield is [latex]=\frac{\text{annual dividend}}{\text{share price}}\times100[/latex] |
| P/E | Price to earnings ratio, share price divided by earnings per share (EPS) over past year (dd indicates loss) |
| Vol [latex]100[/latex]s | The number of shares traded yesterday in [latex]100[/latex]s |
| High | The highest price at which stocks traded yesterday |
| Low | The lowest price at which stocks traded yesterday |
| Close | The price at which the stock traded at the close of the market yesterday |
| Net Chg | Net change; change in price from market close [latex]2[/latex] days ago to yesterday’s close |
The formulas for yield and price to earnings is a good way to measure how much the stock returns per share. Their values are calculated in the stock table, but deserve attention here.
percent yield and price of earnings formulas
The price to earnings ratio of a stock, P/E, is [latex]\text{P/E}=\frac{\text{Share Price}}{\text{EPS}}[/latex].
The percent yield for a stock, Yld[latex]\%[/latex], is
It should be noted that the price of a stock increases and decreases every moment, and so these value change as the share price changes.
- Find the percent yield for a stock with a price of [latex]$30.69[/latex] and an annual dividend of [latex]$1.48[/latex].
- Find the percent yield for a stock with a price of [latex]$62.25[/latex] and an annual dividend of [latex]$1.76[/latex].
The stock table information is also available online, from websites such as cnn.com/markets, markets.businessinsider.com/stocks, and marketwatch.com. The same information is available from these sites as from the print listings, but are often accessed one stock at a time.
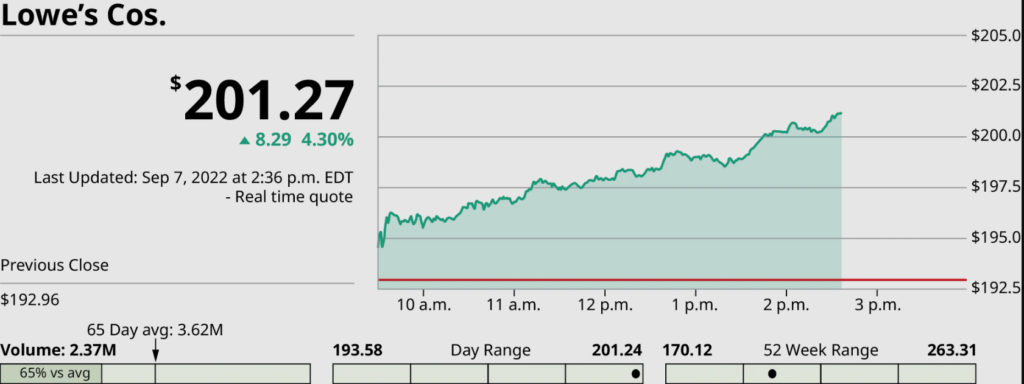
Other key data is further down on the website, and is shown below.
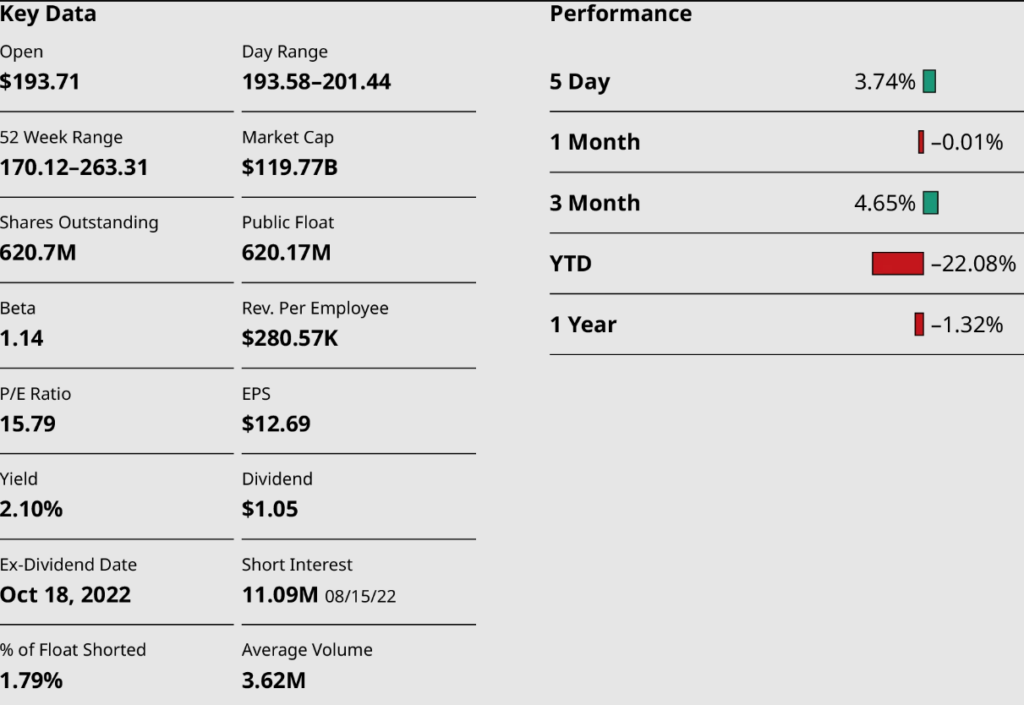
Notice that the [latex]52[/latex]-week high and low are now shown as the [latex]52[/latex]-week range. However, you get additional information, including the stock performance over the past [latex]5[/latex] days, past month, past [latex]3[/latex] months, the year to date (YTD), and over the past year. You can also read the number of shares outstanding, the expected date for the dividend (EX-DIVIDEND DATE), and importantly for the P/E ratio, the earning per share (EPS).
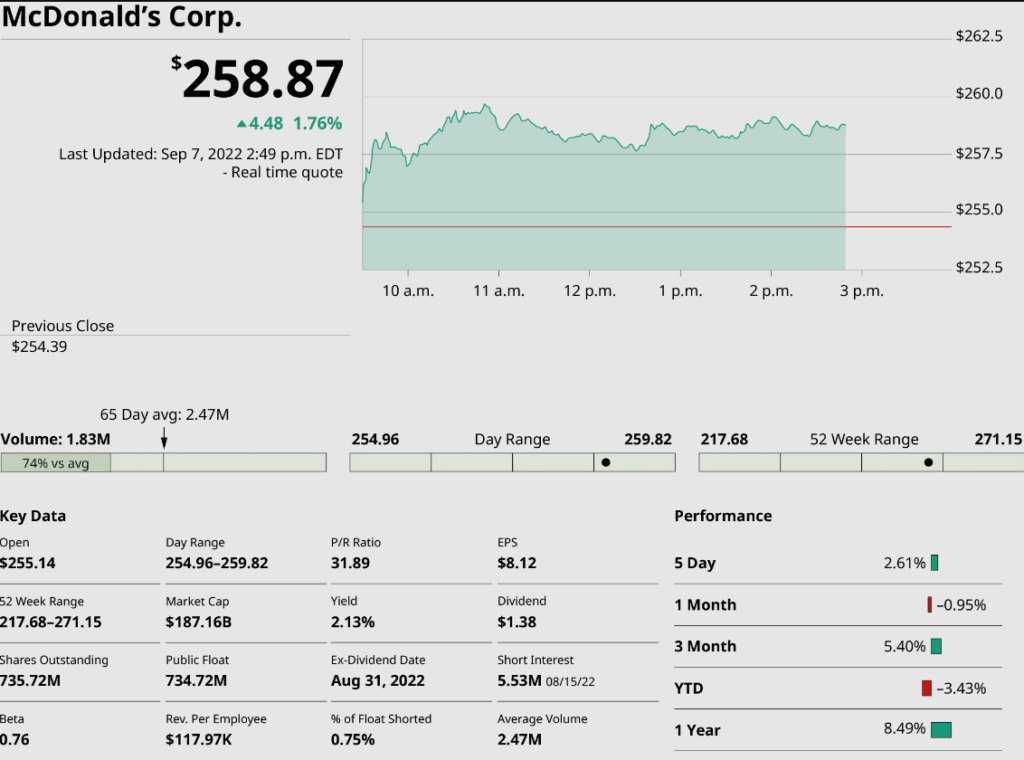
- What is the current price for McDonald’s Corp on this date?
- What is the [latex]52[/latex]-wk high? [latex]52[/latex]-wk low?
- When is the dividend expected?
- What is its yield?
- What is the earnings per share?
As mentioned, stocks earn money in two ways, through dividends and increase in share price.
How to: Determine Dividend Earnings from Stocks
- Identify Dividend Yield: Determine the dividend yield of the stock, which can be expressed as a percentage of the stock’s current price or a fixed monetary value.
- Calculate Dividend Earnings: Multiply the dividend yield by the total investment in the stock to determine the annual dividend earnings. This represents the income received from the stock’s dividend payments.
How to: Determine Profit from Increase in Share Price
- Identify Initial and Final Share Prices: Determine the initial purchase price and the final selling price of the stock. This represents the change in the stock’s value over a specific period.
- Calculate Price Increase: Subtract the initial share price from the final share price to determine the increase in share price. This represents the capital gain or profit made from the appreciation of the stock’s value.
- Calculate Total Profit: Multiply the increase in share price per share by the number of shares owned to determine the total profit from the increase in share price.
- How much money did Vincent make?
- What was his return on investment for that one year?