Spreadsheet Hands-On: Use Excel to find the regression line
Let’s look at an example of using a spreadsheet to perform linear regression on a data set.
The following set of data represents the annual sales of a company in millions of dollars since the year 2003. Let [latex]y[/latex] represent the quantity of sales and let [latex]x[/latex] represent the number of years since 2003.
| [latex]x[/latex] | [latex]0[/latex] | [latex]1[/latex] | [latex]2[/latex] | [latex]3[/latex] | [latex]4[/latex] | [latex]5[/latex] |
| [latex]y[/latex] | [latex]733[/latex] | [latex]841[/latex] | [latex]964[/latex] | [latex]1162[/latex] | [latex]1346[/latex] | [latex]1529[/latex] |
Using the techniques you learned in the previous section, store the data in a spreadsheet and use the computer to find the regression line (also called a trendline).
Step 1: Store the data
- As you did before, label two columns with the the input and the output of the data table. Then highlight both columns at once and choose Scatter with Smooth Lines.
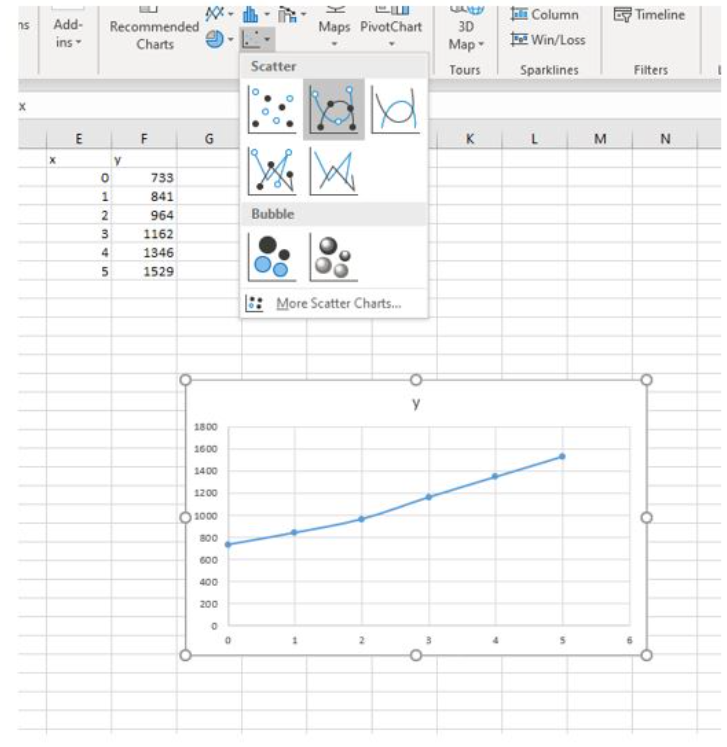
Figure 1. Create a scatter plot - Click on the chart, then on the style icon with the plus-sign on it, hover over Trendline, click the right arrow, and choose More Options… to open the Format Trendline pane.
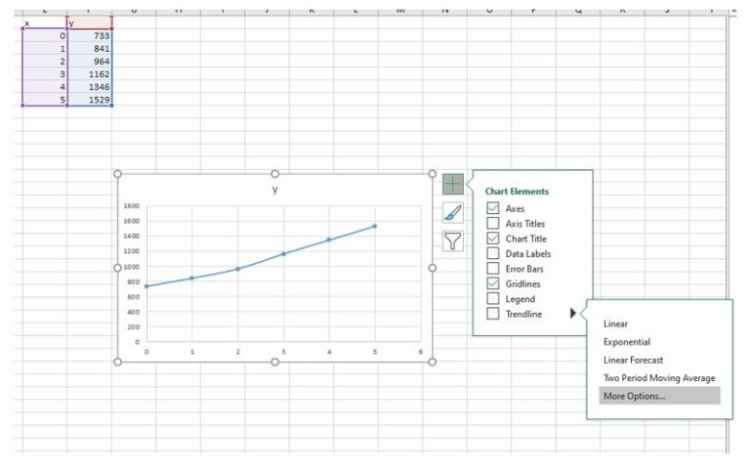
Figure 2. Create a trendline - Choose Linear under Trendline Options, then click Display Equation on chart and Display R-squared value on chart.
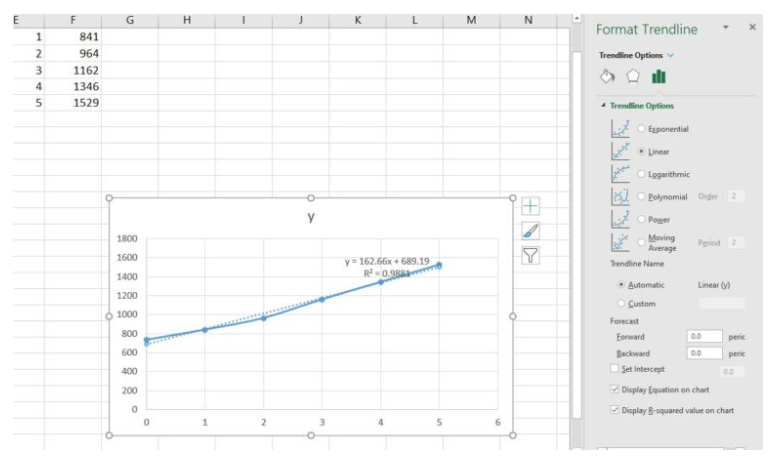
Figure 3. Add the function equation - Note that the equation of the regression line is [latex]y = 162.66x+689.19[/latex] and the [latex]r^2[/latex] value is [latex]0.9881[/latex] (Excel uses a capital R for the coefficient of determination, but we will use a lower-case [latex]r[/latex]). What does the coefficient of determination [latex]r^2[/latex] tell us about the appropriateness of the regression line to model the data? Since [latex]0.9881[/latex] is very close to [latex]1[/latex], this model is a good fit for the data. A coefficient of determination greater than [latex]0.7[/latex] is usually considered good, but there are cases in which a large [latex]r^2[/latex] doesn’t explain well and when a small [latex]r^2[/latex] is considered sufficient. Each situation is different.
In this case, we can use the model to make predictions about the situation. It should be used with caution though, as the only factual information we possess is the data collected. When we make predictions outside a data set, we are said to be extrapolating from the data, which is irresponsible to rely upon as though the prediction is factual. Making predictions within the known data, called interpolating, is much safer since models tend to experience model breakdown, an input beyond which the predicted output does not make sense.
We can also use graphing calculators to perform linear regression. The following video provides an example.
You can view the transcript for “Ex 2: Creating a Scatter Plot and Performing Linear Regression on the Calculator” here (opens in new window).