Data Visualization and Analysis Using Spreadsheets Cont.
Having explored the digital landscape of customer reviews, we now turn our attention to a more physical space: a city park. This scenario will provide you with a different type of data – the ebb and flow of visitors in a public space. Here, you’ll apply the same principles of data visualization and analysis to understand patterns in a real-world, community setting.
Scenario 3: City Park Visitor Count
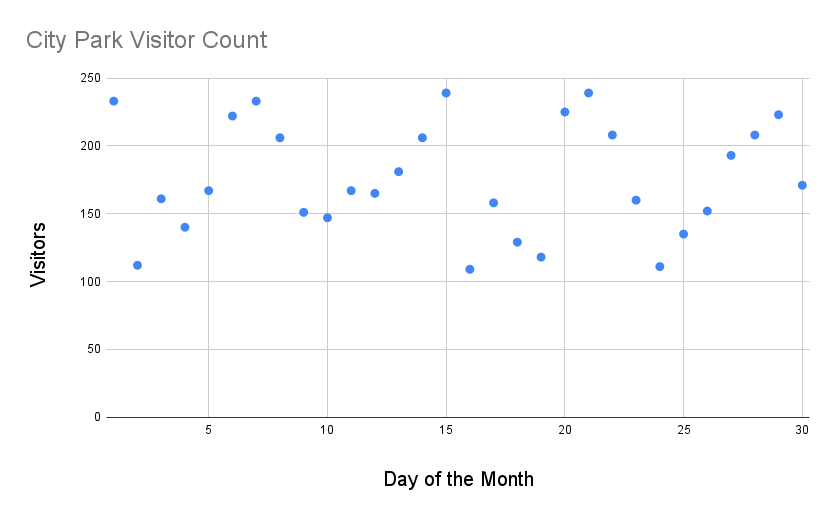
The city council is interested in understanding the visitor trends in the main city park. The daily visitor count data for the last month is given below.
| Day | Visitors |
|---|---|
| 1 | [latex]233[/latex] |
| 2 | [latex]112[/latex] |
| 3 | [latex]161[/latex] |
| 4 | [latex]140[/latex] |
| 5 | [latex]167[/latex] |
| 6 | [latex]222[/latex] |
| 7 | [latex]233[/latex] |
| 8 | [latex]206[/latex] |
| 9 | [latex]151[/latex] |
| 10 | [latex]147[/latex] |
| 11 | [latex]167[/latex] |
| 12 | [latex]165[/latex] |
| 13 | [latex]181[/latex] |
| 14 | [latex]206[/latex] |
| 15 | [latex]239[/latex] |
| 16 | [latex]109[/latex] |
| 17 | [latex]158[/latex] |
| 18 | [latex]129[/latex] |
| 19 | [latex]118[/latex] |
| 20 | [latex]225[/latex] |
| 21 | [latex]239[/latex] |
| 22 | [latex]208[/latex] |
| 23 | [latex]160[/latex] |
| 24 | [latex]111[/latex] |
| 25 | [latex]135[/latex] |
| 26 | [latex]152[/latex] |
| 27 | [latex]193[/latex] |
| 28 | [latex]208[/latex] |
| 29 | [latex]223[/latex] |
| 30 | [latex]171[/latex] |
Plot the daily visitor count data on a scatterplot using a spreadsheet. Let the [latex]x[/latex]-axis represent the days (from [latex]1[/latex] to [latex]30[/latex]) and the [latex]y[/latex]-axis represent the visitor count.
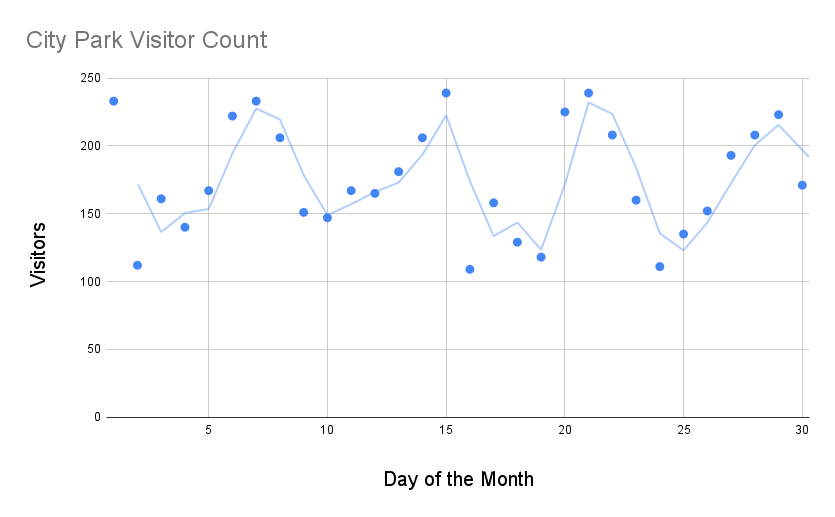
Add a trendline to your scatterplot. Experiment with different types of trendlines and choose the one that you think best represents the visitor trends.
As this activity comes to a close, take a moment to reflect on the diverse applications of data visualization and trend analysis. From understanding business performance and consumer behavior online to analyzing foot traffic in public spaces, your journey through these scenarios emphasizes the versatile nature of data. Consider how the choice of trendlines can significantly impact our interpretations and the importance of selecting the most appropriate model for each unique set of data. Excellent work today!