Mandelbrot Set
The Mandelbrot Set is a set of numbers defined based on recursive sequences.
Mandelbrot Set
For any complex number [latex]c[/latex], define the sequence:
If this sequence always stays close to the origin (within [latex]2[/latex] units), then the number [latex]c[/latex] is part of the Mandelbrot Set. If the sequence gets far from the origin, then the number [latex]c[/latex] is not part of the set.
To generate the Mandelbrot Set you’ll need to multiply complex numbers.
Recall that multiply [latex](a + bi)^2[/latex] uses the same technique as squaring a binomial such as [latex](a + b)^{2}[/latex], with the added condition that [latex]i^{2}=-1[/latex]. When squaring binomials, you can follow the pattern [latex](a+b)^{2} = a^2 + 2ab + b^2[/latex].
When squaring complex numbers, follow a similar pattern that takes into account the fact that [latex]i^{2}=-1[/latex].
Determine if [latex]c=1+i[/latex] is part of the Mandelbrot Set.
Determine if [latex]c=0.5i[/latex] is part of the Mandelbrot Set.
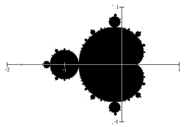
If all complex numbers are tested, and we plot each number that is in the Mandelbrot Set on the complex plane, we obtain the shape to the right.
The boundary of this shape exhibits quasi-self-similarity, in that portions look very similar to the whole.
In addition to coloring the Mandelbrot Set itself black, it is common to color the points in the complex plane surrounding the set. To create a meaningful coloring, often people count the number of iterations of the recursive sequence that are required for a point to get further than [latex]2[/latex] units away from the origin. For example, using [latex]c=1+i[/latex] above, the sequence was distance [latex]2[/latex] from the origin after only two recursions.
For some other numbers, it may take tens or hundreds of iterations for the sequence to get far from the origin. Numbers that get big fast are colored one shade, while colors that are slow to grow are colored another shade. For example, in the image below light blue is used for numbers that get large quickly, while darker shades are used for numbers that grow more slowly. Greens, reds, and purples can be seen when we zoom in—those are used for numbers that grow very slowly.

The Mandelbrot Set, for having such a simple definition, exhibits immense complexity. Zooming in on other portions of the set yields fascinating swirling shapes. This zoom GIF file on the Wikipedia Mandelbrot Set entry illustrates what it looks like to zoom in.