Bubble Charts
Bubble charts are a popular data visualization tool that can help individuals analyze trends and patterns in data over time. These charts use bubbles of different sizes and colors to represent data points, with the size of the bubble indicating the magnitude of the value and the color representing a specific category.
To effectively analyze bubble charts, it is important to understand the key components of this type of visualization. Bubble charts typically feature a horizontal and vertical axis that displays different variables, and the bubbles are arranged on the chart based on their values for these variables. The size of each bubble represents the magnitude of the data point, and the color represents a specific category or grouping.
bubble charts
Bubble charts use bubbles of different sizes and colors to represent data points, with the size indicating the magnitude and the color representing a specific category.
Understanding the horizontal and vertical axes that display different variables and how the bubbles are arranged based on their values is key to effectively analyzing bubble charts.
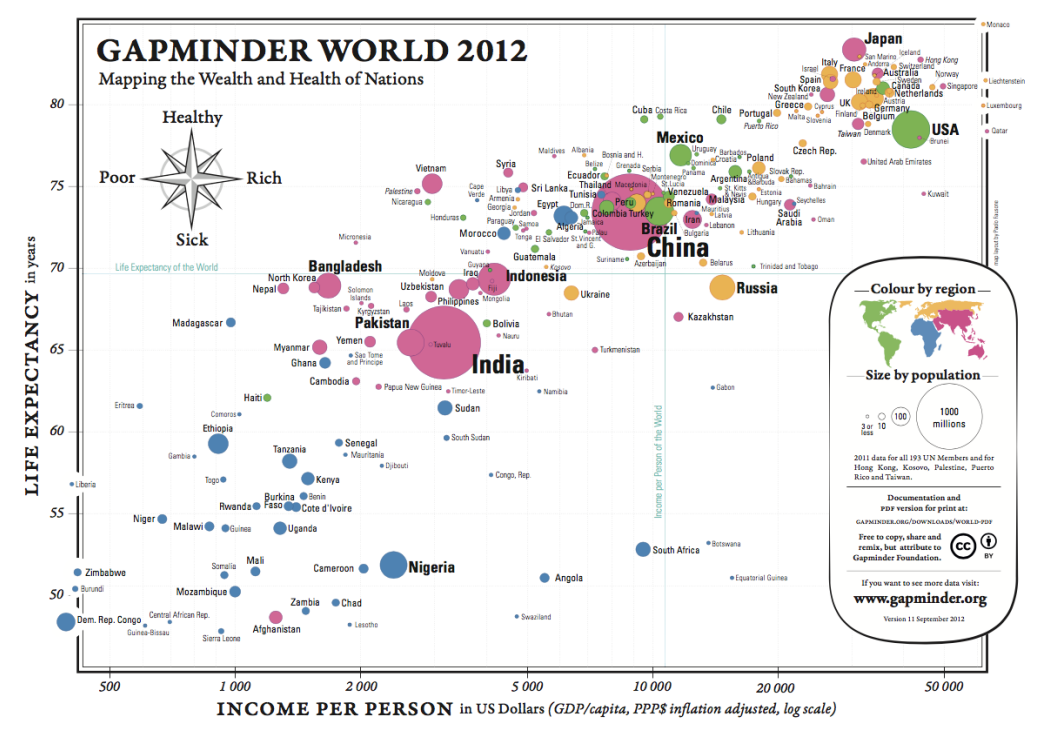
The bubble chart below represents four variables of data. Each variable is represented in a different way on the graph. The correspondence is given in the following table:
| Variable | Representation |
|---|---|
| Life Expectancy | Vertical Axis |
| Income per Person | Horizontal Axis |
| Population of Country | Size of Bubble |
| Region of Country | Color of Bubble |