- Determine the exact location of a point on a graph
The rectangular coordinate system is also called the [latex]x\text{-}y[/latex] plane, the coordinate plane, or the Cartesian coordinate system (since it was developed by a mathematician named René Descartes.)
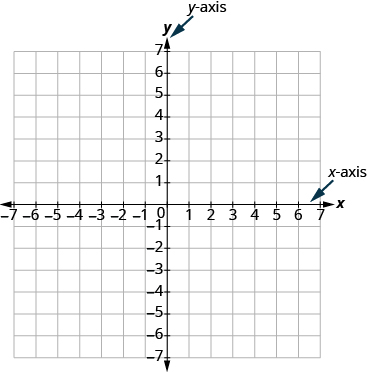
the rectangular coordinate system
The rectangular coordinate system is a two-dimensional plane defined by a pair of perpendicular axes, usually labeled [latex]x[/latex] (horizontal) and [latex]y[/latex] (vertical), used to plot points, lines, and curves by assigning them coordinates based on their distance from these axes.
In the rectangular coordinate system, every point is represented by an ordered pair. The first number in the ordered pair is the [latex]x[/latex]-coordinate of the point, and the second number is the [latex]y[/latex]-coordinate of the point.
Ordered Pair
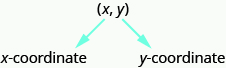
An ordered pair, [latex]\left(x,y\right)[/latex] gives the coordinates of a point in a rectangular coordinate system.
[latex]\begin{array}{c}\text{The first number is the }x\text{-coordinate}.\hfill \\ \text{The second number is the }y\text{-coordinate}.\hfill \end{array}[/latex]
So how do the coordinates of a point help you locate a point on the [latex]x\text{-}y[/latex] plane?
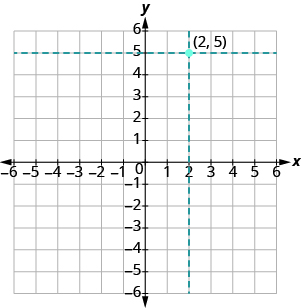
Let’s try locating the point [latex]\left(2,5\right)[/latex] . In this ordered pair, the [latex]x[/latex] -coordinate is [latex]2[/latex] and the [latex]y[/latex] -coordinate is [latex]5[/latex] .
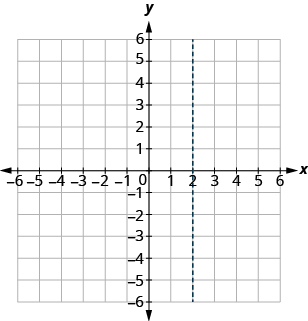
We start by locating the [latex]x[/latex] value, [latex]2[/latex], on the [latex]x\text{-axis.}[/latex] Then we lightly sketch a vertical line through [latex]x=2[/latex], as shown in the image below.
Now we locate the [latex]y[/latex] value, [latex]5[/latex], on the [latex]y[/latex] -axis and sketch a horizontal line through [latex]y=5[/latex] . The point where these two lines meet is the point with coordinates [latex]\left(2,5\right)[/latex]. We plot the point there, as shown in the image below.