- Define apportionment and its importance in political representation in the United States and other representative democracies
- Identify various methods of apportionment, including Hamilton’s method, Jefferson’s method, Webster’s method, Huntington-Hill method, and Lowndes’ method
- Understand the apportionment process for legislative districts
Apportionment
Apportionment: The process of fairly dividing a fixed number of resources (like seats in a legislative body) among groups of varying sizes.
Political Importance: Apportionment in politics ensures fair representation by allocating elected officials based on area and population.
Constraints: Whole numbers only, must use all resources, each group gets at least one, and division should be proportional to population size.
Below are important things to consider when thinking about apportionment.
- Zero-Sum Game: If one state gains a representative, another must lose one.
- Minimum Allocation: Every state or group must receive at least one of the resources being divided.
- Whole Numbers: Apportionment deals with whole numbers; you can’t have [latex]3.4[/latex] representatives.
- Proportional Representation: While exact proportionality isn’t possible due to the whole number constraint, strive for as close to proportional as possible.
For more information on the basics of apportionment, watch the following video.
You can view the transcript for “Introduction to Apportionment” here (opens in new window).
Hamilton’s Method
Hamilton’s Method: A step-by-step approach to apportionment, initially proposed by Alexander Hamilton and used in the U.S. from 1852 to 1911.
The steps to applying Hamilton’s method are:
- Determine how many people each representative should represent. Do this by dividing the total population of all the states by the total number of representatives. This answer is called the divisor.
- Divide each state’s population by the divisor to determine how many representatives it should have. Record this answer to several decimal places. This answer is called the quota. Since we can only allocate whole representatives, Hamilton resolves the whole number problem, as follows:
- Cut off all the decimal parts of all the quotas (but don’t forget what the decimals were). These are called the lower quotas. Add up the remaining whole numbers. This answer will always be less than or equal to the total number of representatives (and the “or equal to” part happens only in very specific circumstances that are incredibly unlikely to turn up).
- Assuming that the total from Step 3 was less than the total number of representatives, assign the remaining representatives, one each, to the states whose decimal parts of the quota were largest, until the desired total is reached.
Quota Rule: A guideline suggesting that the final number of representatives should be within one of the state’s quota.
Paradoxes: Hamilton’s method is subject to several paradoxes, such as the Alabama Paradox, the New States Paradox, and the Population Paradox.
Terms to remember:
- Divisor: Calculated by dividing the total population by the total number of representatives. It’s the baseline for apportionment.
- Quota: Each state’s population divided by the divisor, kept to several decimal places.
- Lower Quotas: The whole number parts of the quotas. Summing these will always be less than or equal to the total number of representatives.
- Quota Rule: Aim for the final number of representatives to be within one of the state’s quota for fairness.
Use Hamilton’s method to apportion the [latex]75[/latex] seats of Rhode Island’s House of Representatives among its five counties.
[latex]\begin{array}{lr} \text { County } & \text { Population }\\ \hline \text { Bristol } & 49,875\\ \text { Kent } & 166,158\\ \text { Newport } & 82,888\\ \text { Providence } & 626,667\\ \text { Washington } & 126,979\\ \textbf{ Total } & \bf{ 1,052,567 }\end{array}[/latex]
For more information on Hamilton’s method, watch the following video.
You can view the transcript for “Apportionment: Hamilton’s Method” here (opens in new window).
Jefferson’s Method
Jefferson’s Method: An alternative to Hamilton’s method, used in Congress from 1791 through 1842, which favors larger states.
The steps to applying Jefferson’s method are:
- Determine how many people each representative should represent. Do this by dividing the total population of all the states by the total number of representatives. This answer is called the standard divisor.
- Divide each state’s population by the divisor to determine how many representatives it should have. Record this answer to several decimal places. This answer is called the quota.
- Cut off all the decimal parts of all the quotas (but don’t forget what the decimals were). These are the lower quotas. Add up the remaining whole numbers. This answer will always be less than or equal to the total number of representatives.
- If the total from Step 3 was less than the total number of representatives, reduce the divisor and recalculate the quota and allocation. Continue doing this until the total in Step 3 is equal to the total number of representatives. The divisor we end up using is called the modified divisor or adjusted divisor.
Divisor-Adjusting Methods: Jefferson’s method is one such method, and it’s not guaranteed to follow the quota rule.
Terms to remember:
- Standard Divisor: The total population of all states divided by the total number of representatives. Think of it as the “benchmark” for how many people each representative should represent.
- Quota: Each state’s population divided by the standard divisor, recorded to several decimal places. It’s the “ideal” number of representatives for each state, but it’s not the final answer.
- Modified Divisor: The divisor that is adjusted until the total number of representatives matches the required total. If the initial total number of representatives is less than required, reduce the divisor and recalculate until they match.
We’ll apply Jefferson’s method for Rhode Island. Recall, the Rhode Island’s House of Representatives splits [latex]75[/latex] seats among its five counties.
[latex]\begin{array}{lr} \text { County } & \text { Population }\\ \hline \text { Bristol } & 49,875\\ \text { Kent } & 166,158\\ \text { Newport } & 82,888\\ \text { Providence } & 626,667\\ \text { Washington } & 126,979\\ \textbf{ Total } & \bf{ 1,052,567 }\end{array}[/latex]
Notice, in comparison to Hamilton’s method, that although the results were the same, they came about in a different way, and the outcome was almost different. Providence County (the largest) almost went up to [latex]46[/latex] representatives before Kent (which is much smaller) got to [latex]12[/latex]. Although that didn’t happen here, it can. Divisor-adjusting methods like Jefferson’s are not guaranteed to follow the quota rule! For more information on Jefferson’s method, watch the following video.
You can view the transcript for “Apportionment: Jefferson’s Method” here (opens in new window).
Webster’s Method
Webster’s Method: A method similar to Jefferson’s but rounds quotas to the nearest whole number. It was adopted by Congress multiple times and is less biased towards larger states.
The steps to applying Webster’s method are:
- Determine how many people each representative should represent. Do this by dividing the total population of all the states by the total number of representatives. This answer is called the standard divisor.
- Divide each state’s population by the divisor to determine how many representatives it should have. Record this answer to several decimal places. This answer is called the quota.
- Round all the quotas to the nearest whole number (but don’t forget what the decimals were). Add up the remaining whole numbers.
- If the total from Step 3 was less than the total number of representatives, reduce the divisor and recalculate the quota and allocation. If the total from step 3 was larger than the total number of representatives, increase the divisor and recalculate the quota and allocation. Continue doing this until the total in Step 3 is equal to the total number of representatives. The divisor we end up using is called the modified divisor or adjusted divisor.
Balinski-Young Impossibility Theorem: A theorem that states no apportionment method can always follow the quota rule without being subject to paradoxes. Understand that no method is perfect; each has its own set of trade-offs and potential paradoxes.
Terms to remember:
- Standard Divisor: The total population divided by the total number of representatives, serving as the benchmark for representation. It’s your “starting point” for figuring out how many people each representative should ideally represent.
- Quota: The result of dividing each state’s population by the standard divisor, rounded to several decimal places. It’s like your “first draft” of how many representatives each state should have. Don’t forget the decimals; they matter!
- Modified Divisor: The adjusted divisor used when the total number of representatives doesn’t match the required total. If your total number of representatives is off, tweak this number and recalculate.
We’ll apply Webster’s method for Rhode Island. Recall, the Rhode Island’s House of Representatives splits [latex]75[/latex] seats among its five counties.
[latex]\begin{array}{lr} \text { County } & \text { Population }\\ \hline \text { Bristol } & 49,875\\ \text { Kent } & 166,158\\ \text { Newport } & 82,888\\ \text { Providence } & 626,667\\ \text { Washington } & 126,979\\ \textbf{ Total } & \bf{ 1,052,567 }\end{array}[/latex]
Like Jefferson’s method, Webster’s method carries a bias in favor of states with large populations, but rounding the quotas to the nearest whole number greatly reduces this bias. (Notice that Providence County, the largest, is the one that gets a representative trimmed because of the increased quota.) Also like Jefferson’s method, Webster’s method does not always follow the quota rule, but it follows the quota rule much more often than Jefferson’s method does.
For more information on Webster’s method, watch the following video.
You can view the transcript for “Apportionment: Webster’s Method” here (opens in new window).
Huntington-Hill Method
Huntington-Hill Method: The current method of apportionment used in Congress, aiming to minimize the percent differences in representation.
The steps to applying the Huntington-Hill method are:
- Determine how many people each representative should represent. Do this by dividing the total population of all the states by the total number of representatives. This answer is called the standard divisor.
- Divide each state’s population by the divisor to determine how many representatives it should have. Record this answer to several decimal places. This answer is called the quota.
- Cut off the decimal part of the quota to obtain the lower quota, which we’ll call [latex]n[/latex]. Compute [latex]\sqrt{n(n+1)}[/latex], which is the geometric mean of the lower quota and one value higher.
- If the quota is larger than the geometric mean, round up the quota; if the quota is smaller than the geometric mean, round down the quota. Add up the resulting whole numbers to get the initial allocation.
- If the total from Step 4 was less than the total number of representatives, reduce the divisor and recalculate the quota and allocation. If the total from step 4 was larger than the total number of representatives, increase the divisor and recalculate the quota and allocation. Continue doing this until the total in Step 4 is equal to the total number of representatives. The divisor we end up using is called the modified divisor or adjusted divisor.
Terms to remember:
- Standard Divisor: The total population divided by the total number of representatives, serving as the initial benchmark for representation. Think of it as the “ideal” number of people each representative should stand for.
- Quota: The result of dividing each state’s population by the standard divisor, rounded to several decimal places. Keep the decimals; they’re crucial for the next steps.
- Modified Divisor: The adjusted divisor used when the total number of representatives doesn’t match the required total. If your total reps are off, you’ll need to adjust this number and redo your calculations.
- Geometric Mean: Calculated as [latex]\sqrt{n(n+1)}[/latex], where [latex]n[/latex] is the lower quota. It helps in rounding the quota. This is your “rounding guide.” If the quota is larger, round up; if smaller, round down.
We’ll apply the Huntington-Hill method for Rhode Island. Recall, the Rhode Island’s House of Representatives splits [latex]75[/latex] seats among its five counties.
[latex]\begin{array}{lr} \text { County } & \text { Population }\\ \hline \text { Bristol } & 49,875\\ \text { Kent } & 166,158\\ \text { Newport } & 82,888\\ \text { Providence } & 626,667\\ \text { Washington } & 126,979\\ \textbf{ Total } & \bf{ 1,052,567 }\end{array}[/latex]
For more information on the Huntington-Hill method, watch the following video.
You can view the transcript for “Apportionment: Huntington-Hill Method” here (opens in new window).
Lowndes’ Method
Lowndes’ Method: A method proposed by William Lowndes, aiming to favor smaller states in apportionment.
The steps to applying Lowndes’ method are:
- Determine how many people each representative should represent. Do this by dividing the total population of all the states by the total number of representatives. This answer is called the divisor.
- Divide each state’s population by the divisor to determine how many representatives it should have. Record this answer to several decimal places. This answer is called the quota.
- Cut off all the decimal parts of all the quotas (but don’t forget what the decimals were). Add up the remaining whole numbers.
- Assuming that the total from Step 3 was less than the total number of representatives, divide the decimal part of each state’s quota by the whole number part. Assign the remaining representatives, one each, to the states whose ratio of decimal part to whole part were largest, until the desired total is reached.
Terms to remember:
- Divisor: The total population divided by the total number of representatives, serving as the initial benchmark for representation. This is the “average” representation. Divide the total population by the total number of reps to find it.
- Quota: The result of dividing each state’s population by the divisor, rounded to several decimal places. Record this number to several decimal places; they play a crucial role in the next steps.
- Decimal to Whole Ratio: The ratio of the decimal part of each state’s quota to the whole number part, used to decide where the remaining representatives should go. This ratio helps determine where additional representatives will make the most impact, especially for smaller states.
We’ll apply Lowndes’ method for Rhode Island. Recall, the Rhode Island’s House of Representatives splits [latex]75[/latex] seats among its five counties.
[latex]\begin{array}{lr} \text { County } & \text { Population }\\ \hline \text { Bristol } & 49,875\\ \text { Kent } & 166,158\\ \text { Newport } & 82,888\\ \text { Providence } & 626,667\\ \text { Washington } & 126,979\\ \textbf{ Total } & \bf{ 1,052,567 }\end{array}[/latex]
For more information on Lowndes’ method, watch the following video.
You can view the transcript for “Apportionment: Lowndes’ Method” here (opens in new window).
Apportionment of Legislative Districts
Legislative Districts: Areas drawn to represent a fixed number of constituents, aiming for equal representation. These are not always aligned with county or city boundaries; they are drawn to equalize the number of constituents.
Redistricting: The process of redefining legislative districts to accommodate population changes. This is usually done by the legislature itself, so be aware of potential biases.
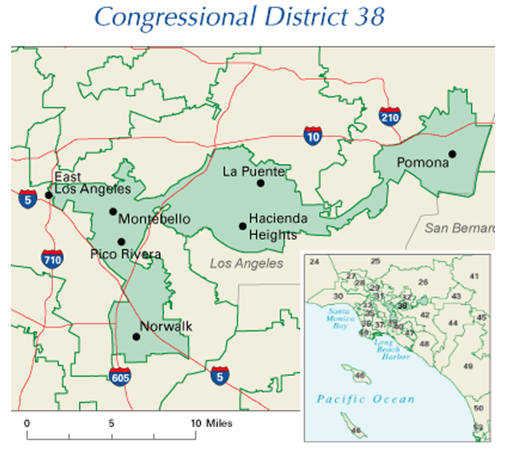
Gerrymandering: Manipulating district boundaries to favor a particular political party or group. Keep an eye out for oddly shaped districts; they might be a sign of gerrymandering.
The map to the right shows the [latex]38^{th}[/latex] congressional district in California in 2004[1]. This district was created through a bi-partisan committee of incumbent legislators. This gerrymandering leads to districts that are not competitive; the prevailing party almost always wins with a large margin.
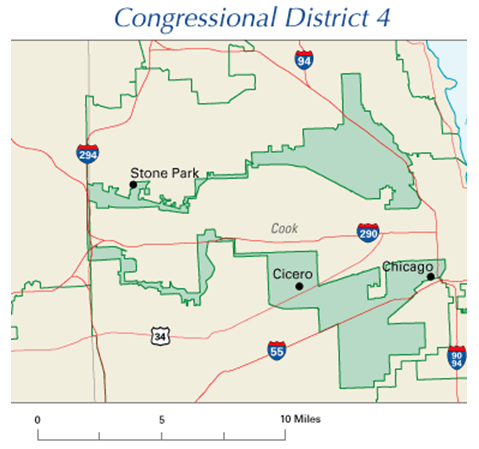
The map to the right shows the [latex]4^{th}[/latex] congressional district in Illinois in 2004.[2] This district was drawn to contain the two predominantly Hispanic areas of Chicago. The largely Puerto Rican area to the north and the southern Mexican areas are only connected in this districting by a piece of the highway to the west.
For more information on gerrymandering, watch the following video.
You can view the transcript for “Gerrymandering: How drawing jagged lines can impact an election – Christina Greer” here (opens in new window).