- Differentiate correlation from causation
- Decide on the suitability of interpolation and extrapolation
- Identify the appropriate way to represent data and mathematical models
- Use multiple representations to choose a model
- Recognize the limits of models
What a Wonderful World!
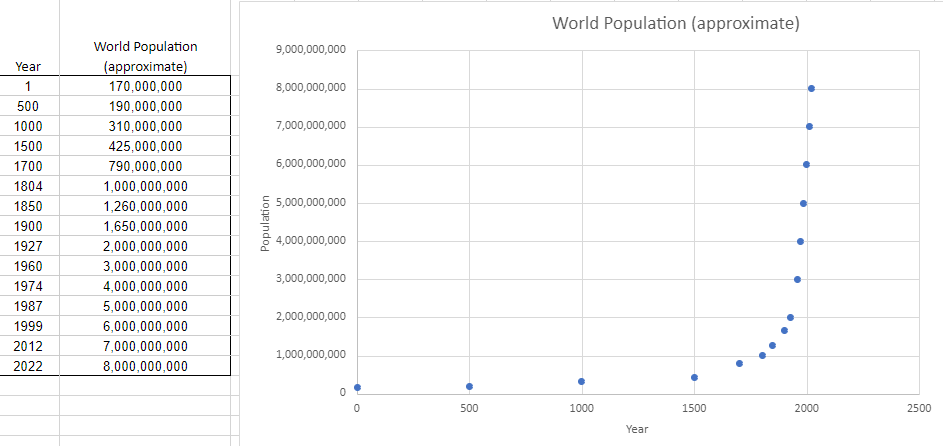
The following table and graph show the approximate world population at various time points since [latex]1[/latex] AD.
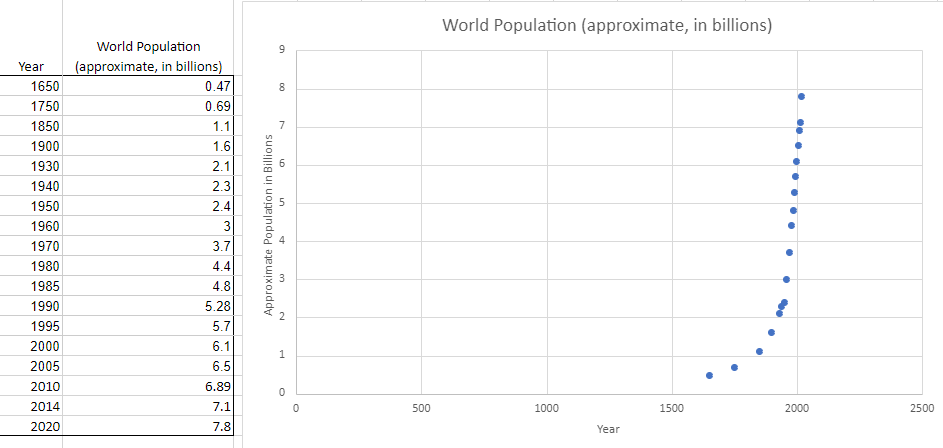
The following table and graph give a different view of the history of the approximate world population (in billions). In this case, the estimates are at various time points since 1650.