- Use a spreadsheet to calculate the mean, median, and mode for a data set
- Use a spreadsheet to calculate the range and standard deviation for a data set
- Create graphical comparisons between two data sets to identify differences in their characteristics
Data Exploration: Menu Prices

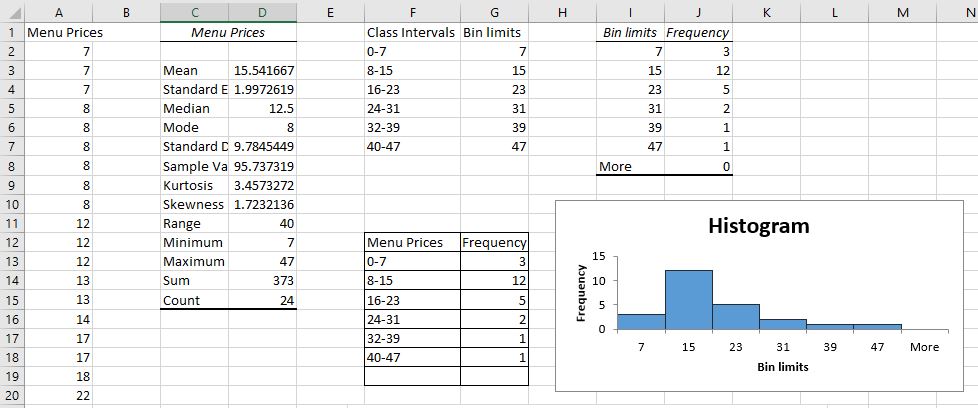
A downtown historic district has taken a census of the average dinner plate price at all the main-street restaurants. They are displayed in the table below, rounded to the nearest dollar.
| [latex]$7[/latex] | [latex]$7[/latex] | [latex]$7[/latex] | [latex]$8[/latex] | [latex]$8[/latex] | [latex]$8[/latex] |
| [latex]$8[/latex] | [latex]$8[/latex] | [latex]$8[/latex] | [latex]$12[/latex] | [latex]$12[/latex] | [latex]$12[/latex] |
| [latex]$13[/latex] | [latex]$13[/latex] | [latex]$14[/latex] | [latex]$17[/latex] | [latex]$17[/latex] | [latex]$18[/latex] |
| [latex]$22[/latex] | [latex]$23[/latex] | [latex]$25[/latex] | [latex]$27[/latex] | [latex]$32[/latex] | [latex]$47[/latex] |
Hands-on Spreadsheet: Explore the Data
Store the data in a new sheet named Menu Prices. You can use a Microsoft Excel spreadsheet, a Apache OpenOffice Calc spreadhseet or a Google Sheets spreadsheet.
Using your spreadsheet, obtain the descriptive statistics. What are the mean, median, and mode? What is the range, minimum and maximum? What is the standard deviation? What is the skewness?

Now, using your spreadsheet, create a frequency table and histogram. Use [latex]6[/latex] intervals beginning with [latex]0-7[/latex].