- Identify methods for obtaining a random sample of the intended population of a study
- Identify types of sample bias
- Identify the differences between observational studies and experiments, and the treatment in an experiment
- Determine whether an experiment may have been influenced by confounding
Statistical Inference
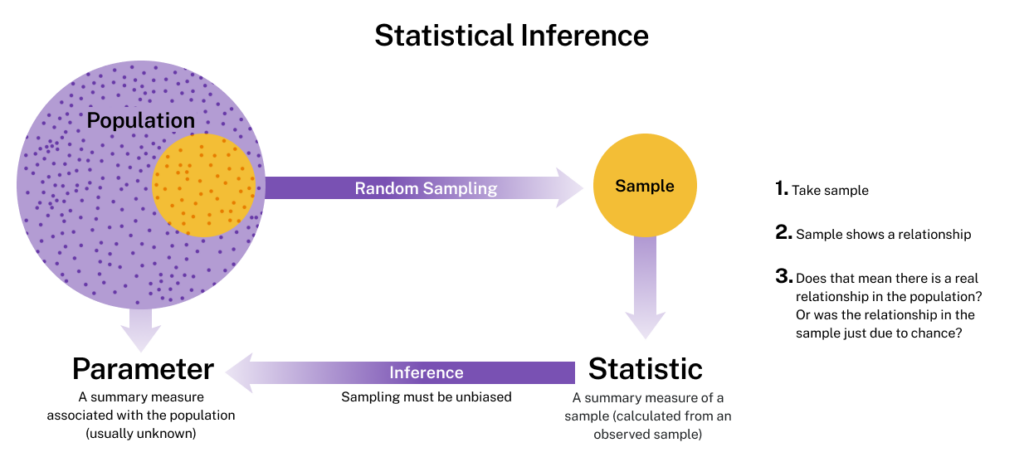
The process of taking a statistic from a sample and determining a parameter for a population is called statistical inference.
- Population: [latex]200[/latex] students at the college.
- Variable: Eligibility for financial aid is a categorical variable, so we use a proportion as a summary.
- Parameter = Population Proportion: [latex]60%[/latex] students or [latex]0.6[/latex] of the population is eligible for financial aid.
Note: Populations are usually much larger than [latex]200[/latex] people. Also, in real situations, we do not know the population proportion. We are using a simplified situation to investigate how random samples relate to the population. This is the first step in creating a probability model that will be useful in inference. How accurate are random samples at predicting this population proportion of [latex]0.60[/latex]? To answer this question, we randomly select [latex]8[/latex] students and determine the proportion who are eligible for financial aid. We repeat this process several times. Here are the results for [latex]3[/latex] random samples: 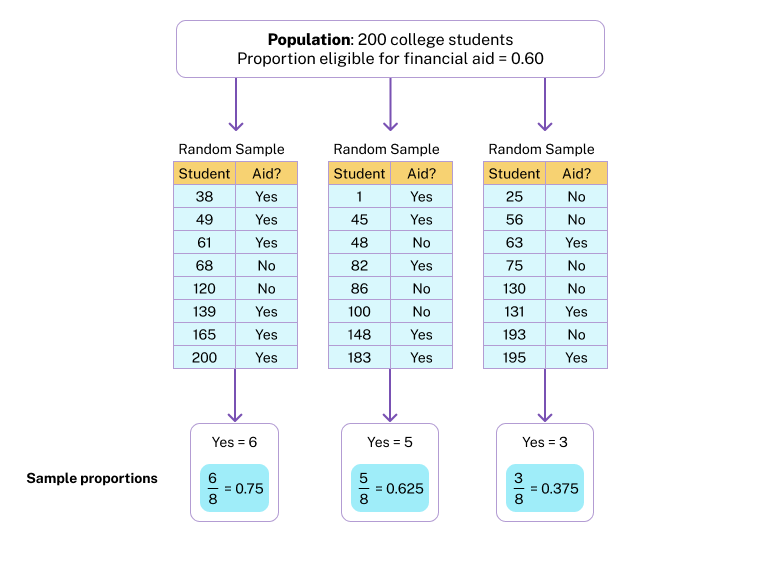
Sampling Bias
Remember that the ideal sample should be representative of the entire population.
In statistics, a sampling bias is created when a sample is collected from a population and some members of the population are not as likely to be chosen as others (remember, each member of the population should have an equally likely chance of being chosen). When a sampling bias happens, there can be incorrect conclusions drawn about the population that is being studied.
sampling bias
Sampling bias occurs when some members of the intended population are less likely to be included in the sample than others, resulting in a sample that is not representative of the population as a whole.
When we say a random sample represents the population well, we mean that there is no inherent bias in this sampling technique. It is important to acknowledge, though, that this does not mean all random samples are necessarily “perfect.”
Random samples are still random, and therefore no random sample will be exactly the same as another. One random sample may give a fairly accurate representation of the population, while another random sample might be “off” purely because of chance. Unfortunately, when looking at a particular sample (which is what happens in practice), we never know how much it differs from the population.