Quadratic Functions: Get Stronger Answer Key

Introduction to Quadratic Functions and Parabolas

  1. [latex]g(x)=(x 1)^2−4,[/latex]; Vertex: [latex](−1,−4)[/latex]
  2. [latex]f(x)=(x \frac{5}{2})^2−\frac{33}{4}[/latex]; Vertex: [latex](−\frac{5}{2},−\frac{33}{4})[/latex]
  3. [latex]f(x)=3(x−1)^2−12,[/latex]; Vertex: [latex](1,−12)[/latex]
  4. [latex]f(x)=3(x−\frac{5}{6})^2−\frac{37}{12},[/latex]; Vertex: [latex](\frac{5}{6},−\frac{37}{12})[/latex]
  5. Minimum is [latex]−\frac{17}{2}[/latex] and occurs at [latex]\frac{5}{2}[/latex]. Axis of symmetry is [latex]x=\frac{5}{2}[/latex].
  6. Minimum is [latex]−\frac{17}{16}[/latex] and occurs at [latex]−\frac{1}{8}[/latex]. Axis of symmetry is [latex]x=−\frac{1}{8}[/latex].
  7. Minimum is [latex]−\frac{7}{2}[/latex] and occurs at [latex]−3[/latex]. Axis of symmetry is [latex]x=−3[/latex].
  8. Domain is [latex](−∞,∞)[/latex]. Range is [latex][2,∞)[/latex].
  9. Domain is [latex](−∞,∞)[/latex]. Range is [latex][−5,∞)[/latex].
  10. Domain is [latex](−∞,∞)[/latex]. Range is [latex][−12,∞)[/latex].
  11. [latex]f(x)=x^2+4x+3[/latex]
  12. [latex]f(x)=x^2−4x+7[/latex]
  13. [latex]f(x)=−\frac{1}{49}x^2 \frac{6}{49}x \frac{89}{49}[/latex]
  14. [latex]f(x)=x^2−2x+1[/latex]
  15. Vertex: [latex](3, −10)[/latex], axis of symmetry: [latex]x = 3[/latex], intercepts: [latex](3 +\sqrt{10},0)[/latex] and [latex](3-\sqrt{10},0)[/latex]

image

  1. Vertex: [latex](\frac{7}{2},−\frac{37}{4})[/latex], axis of symmetry: [latex]x=\frac{7}{2}[/latex], [latex]y[/latex]-intercept: [latex](0,3)[/latex], [latex]x[/latex]-intercepts: [latex](\frac{7 \sqrt{37}}{2},0),(\frac{7-\sqrt{37}}{2},0)[/latex]

Graph of f(x)=4x^2-12x-3

  1. Vertex: [latex](\frac{3}{2},−12)[/latex], axis of symmetry: [latex]x=\frac{3}{2}[/latex], intercept: [latex]( \frac{3+2\sqrt{3}}{2},0)[/latex] and [latex]( \frac{3-2\sqrt{3}}{2},0)[/latex]image
  2. [latex]f(x)=x^2+2x+3[/latex]
  3. [latex]f(x)=−3x^2−6x−1[/latex]
  4. [latex]f(x)=-\frac{1}{4}x^2 -x+2[/latex]

Complex Numbers and Operations

  1. A graph with the y-axis as imaginary and the x-axis as real. There is a point at 4, 0, labeled 4, a point at 2, 1, labeled 2 + i, a point at 0, 3, labeled -3i, and a point at -2, 3, labeled -2 + 3i.
  2. A graph with the y-axis as imaginary and the x-axis as real. There is a point at 4, 0, labeled 4, a point at 2, 1, labeled 2 + i, a point at 0, 3, labeled -3i, and a point at -2, 3, labeled -2 + 3i.
  3. A graph with the y-axis as imaginary and the x-axis as real. There is a point at 4, 0, labeled 4, a point at 2, 1, labeled 2 + i, a point at 0, 3, labeled -3i, and a point at -2, 3, labeled -2 + 3i.
  4. A graph with the y-axis as imaginary and the x-axis as real. There is a point at 4, 0, labeled 4, a point at 2, 1, labeled 2 + i, a point at 0, 3, labeled -3i, and a point at -2, 3, labeled -2 + 3i.
  5.  -2 on the complex plane
  6. 4i on the complex plane
  7. 1+2i on complex plane
  8. -1-i on complex plane
  9. [latex]5-i[/latex]
  10.  [latex]5-4i[/latex]
  11. [latex]3-5i[/latex]
  12. [latex]-(6+i)[/latex]
  13. [latex]6+12i[/latex]
  14. [latex]10-2i[/latex]
  15.  [latex]14+2i[/latex]
  16. [latex]-2+6i[/latex]
  17. [latex]18+6i[/latex]
  18. [latex]7+3i[/latex]
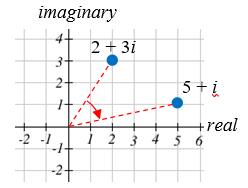
  19. [latex](2+3i)(1-i) = 5+i.[/latex]It appears that multiplying by [latex]1-i[/latex] both scaled the number away from the origin, and rotated it clockwise about [latex]45°[/latex].
    A graph with the y-axis labeled imaginary and the x-axis labeled real. There are red dotted lines connected to each of the two points on the graph. There is a point at 5, 1, labeled 5 + i and another point at 2, 3, labeled 2 + 3i.

Application of Quadratic Functions

  1. The revenue reaches the maximum value when [latex]1800[/latex] thousand phones are produced.
  2. [latex]2.449[/latex] seconds
  3. [latex]41[/latex] trees per acre