Line 1: [latex]m=-10[/latex] Line 2: [latex]m=-10[/latex] Parallel
Line 1: [latex]m=-2[/latex] Line 2: [latex]m=1[/latex] Neither
Line 1: [latex]m=-2[/latex] Line 2: [latex]m=-2[/latex] Parallel
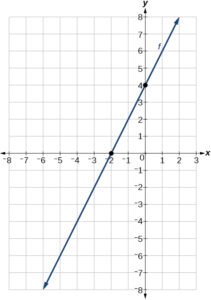
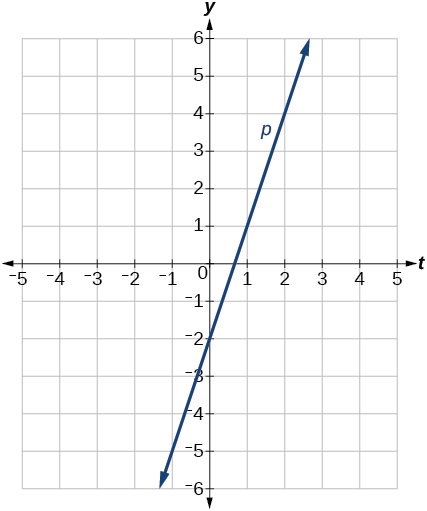
[latex]y=3x-3[/latex]
[latex]y=-\dfrac{3}{3}t+2[/latex]
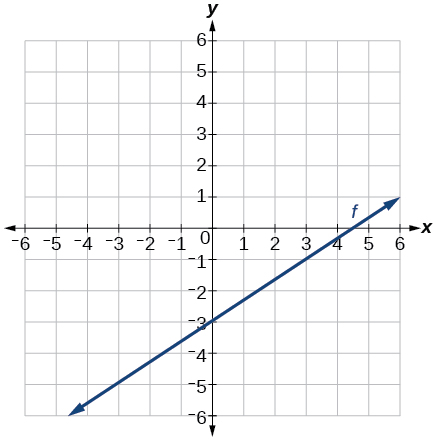
[latex]y=-\dfrac{5}{4}x+5[/latex]
[latex]y=3x-1[/latex]
[latex]y=-2.5[/latex]
F
C
A
[latex]y=3[/latex]
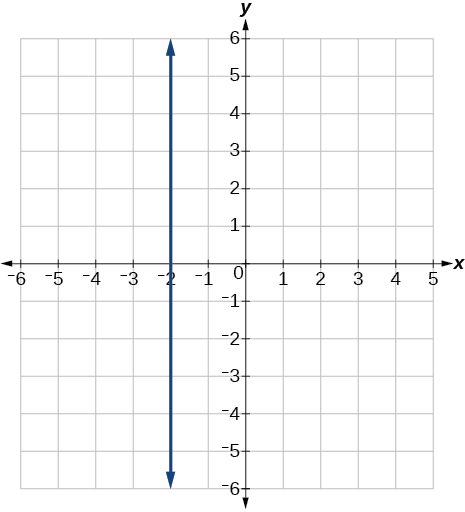
[latex]x=-3[/latex]
Fitting Linear Models to Data
[latex]2,300[/latex]
[latex]64,170[/latex]
[latex]P(t)=75,000+2500t[/latex]
[latex](-30,0)[/latex] Thirty years before the start of this model, the town had no citizens. $$(0,75,000)$$ Initially, the town had a population of [latex]75,000[/latex].
Ten years after the model began
[latex]y=-2t+180[/latex]
In 2070, the company’s profit will be zero.
[latex]y=30t-300[/latex]
[latex](10,0)[/latex] In the year 1990, the company’s profits were zero
[latex]696[/latex] people
[latex]4[/latex] years
[latex]174[/latex] people per year
[latex]305[/latex] people
[latex]P(t)=305+174t[/latex]
[latex]2,219[/latex] people
[latex]C(x)=0.15x+10[/latex]
The flat monthly fee is [latex]$10[/latex] and there is a [latex]$0.15[/latex] fee for each additional minute used
[latex]$113.05[/latex]
[latex]P(t)=190t+4,360[/latex]
[latex]R(t)=-2.1t+16[/latex]
[latex]5.5[/latex] billion cubic feet
During the year 2017
No
No
Interpolation. About [latex]60°F[/latex].
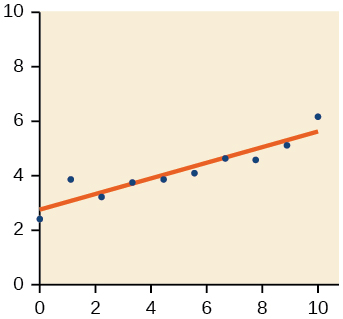
This value of [latex]r[/latex] indicates a strong positive correlation or slope, so D
This value of [latex]r[/latex] indicates a strong negative correlation or slope, so C
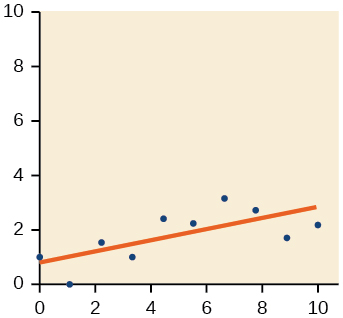
This value of [latex]r[/latex] indicates a weak negative correlation or slope, so B
This value of [latex]r[/latex] indicates a weak negative correlation, so B
Yes, trend appears linear because [latex]r=0.985[/latex] and will exceed [latex]12,000[/latex] near midyear, [latex]2016[/latex], [latex]24.6[/latex] years since [latex]1992[/latex].