Skip to content
Conic Sections: Get Stronger Answer Key
Circles
[latex]x^2 + y^2 = 49[/latex]
[latex]x^2 + y^2 = 2[/latex]
[latex](x - 3)^2 + (y - 5)^2 = 1[/latex]
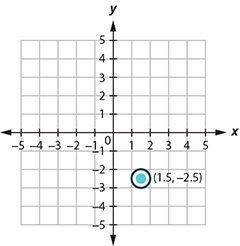
[latex](x - 1.5)^2 + (y + 3.5)^2 = 6.25[/latex]
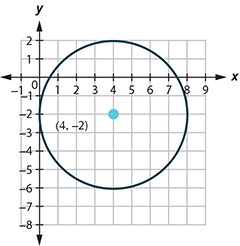
[latex](x - 3)^2 + (y + 2)^2 = 64[/latex]
[latex](x - 4)^2 + (y - 4)^2 = 8[/latex]
The circle is centered at [latex](-5, -3)[/latex] with a radius of [latex]1[/latex].
The circle is centered at [latex](4, -2)[/latex] with a radius of [latex]4[/latex].
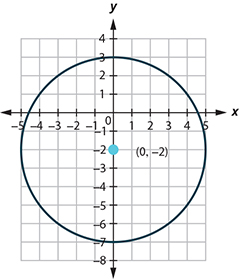
The circle is centered at [latex](0, -2)[/latex] with a radius of [latex]5[/latex].
The circle is centered at [latex](1.5, -2.5)[/latex] with a radius of [latex]0.5[/latex].
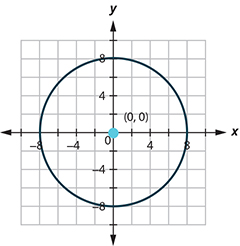
The circle is centered at [latex](0, 0)[/latex] with a radius of [latex]8[/latex].
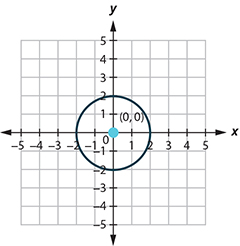
The circle is centered at [latex](0, 0)[/latex] with a radius of [latex]2[/latex].
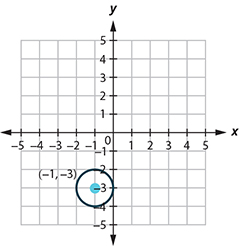
Center: [latex](-1, -3)[/latex], radius: [latex]1[/latex]
Center: [latex](2, -5)[/latex], radius: [latex]6[/latex]
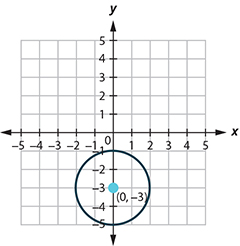
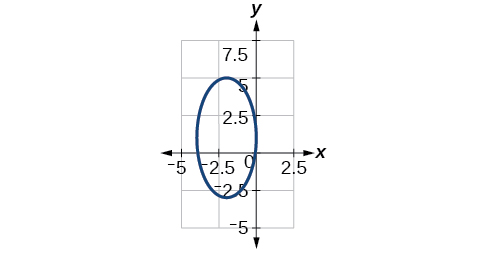
Center: [latex](0, -3)[/latex], radius: [latex]2[/latex]
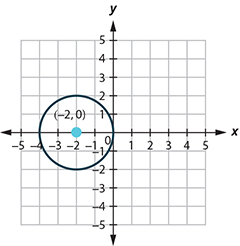
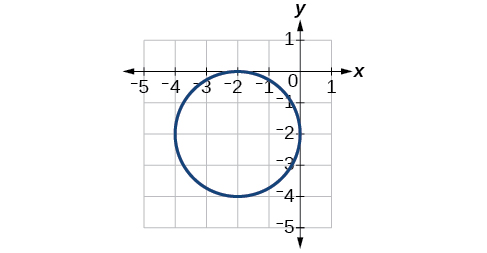
Center: [latex](-2, 0)[/latex], radius: [latex]2[/latex]
Ellipses
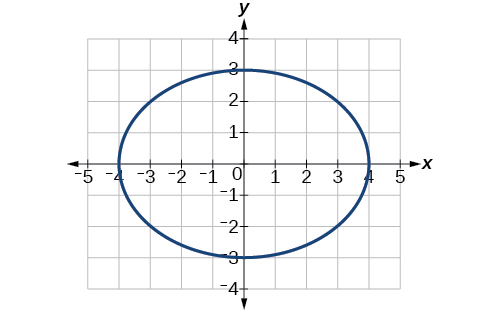
yes; [latex]\dfrac{x^2}{3^2} + \dfrac{y^2}{2^2} = 1[/latex]
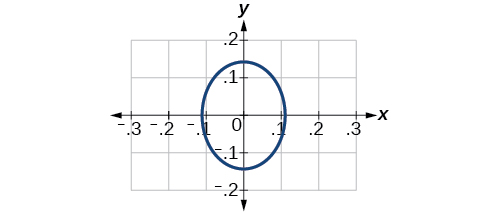
yes; [latex]\dfrac{x^2}{(\dfrac{1}{2})^2} + \dfrac{y^2}{(\dfrac{1}{3})^2} = 1[/latex]
[latex]\dfrac{x^2}{2^2} + \dfrac{y^2}{7^2} = 1[/latex]; Endpoints of major axis [latex](0, 7)[/latex] and [latex](0, -7)[/latex]. Endpoints of minor axis [latex](2, 0)[/latex] and [latex](-2, 0)[/latex]. Foci at [latex](0, 3\sqrt{5})[/latex], [latex](0, -3\sqrt{5})[/latex].
[latex]\dfrac{x^2}{(1)^2} + \dfrac{y^2}{(\dfrac{1}{3})^2} = 1[/latex]; Endpoints of major axis [latex](1, 0)[/latex] and [latex](-1, 0)[/latex]. Endpoints of minor axis [latex](0, \dfrac{1}{3})[/latex], [latex](0, -\dfrac{1}{3})[/latex]. Foci at [latex](\dfrac{2\sqrt{2}}{3}, 0)[/latex], [latex](-\dfrac{2\sqrt{2}}{3}, 0)[/latex].
[latex]\dfrac{(x-2)^2}{7^2} + \dfrac{(y-4)^2}{5^2} = 1[/latex]; Endpoints of major axis [latex](9, 4)[/latex], [latex](-5, 4)[/latex]. Endpoints of minor axis [latex](2, 9)[/latex], [latex](2, -1)[/latex]. Foci at [latex](2 + 2\sqrt{6}, 4)[/latex], [latex](2 - 2\sqrt{6}, 4)[/latex].
[latex]\dfrac{(x+5)^2}{2^2} + \dfrac{(y-7)^2}{3^2} = 1[/latex]; Endpoints of major axis [latex](-5, 10)[/latex], [latex](-5, 4)[/latex]. Endpoints of minor axis [latex](-3, 7)[/latex], [latex](-7, 7)[/latex]. Foci at [latex](-5, 7 + \sqrt{5})[/latex], [latex](-5, 7 - \sqrt{5})[/latex].
[latex]\dfrac{(x-1)^2}{3^2} + \dfrac{(y-4)^2}{2^2} = 1[/latex]; Endpoints of major axis [latex](4, 4)[/latex], [latex](-2, 4)[/latex]. Endpoints of minor axis [latex](1, 6)[/latex], [latex](1, 2)[/latex]. Foci at [latex](1 + \sqrt{5}, 4)[/latex], [latex](1 - \sqrt{5}, 4)[/latex].
[latex]\dfrac{(x-3)^2}{(3\sqrt{2})^2} + \dfrac{(y-5)^2}{(\sqrt{2})^2} = 1[/latex]; Endpoints of major axis [latex](3 + 3\sqrt{2}, 5)[/latex], [latex](3 - 3\sqrt{2}, 5)[/latex]. Endpoints of minor axis [latex](3, 5 + \sqrt{2})[/latex], [latex](3, 5 - \sqrt{2})[/latex]. Foci at [latex](7, 5)[/latex], [latex](-1, 5)[/latex].
[latex]\dfrac{(x+5)^2}{(5)^2} + \dfrac{(y-2)^2}{(2)^2} = 1[/latex]; Endpoints of major axis [latex](0, 2)[/latex], [latex](-10, 2)[/latex]. Endpoints of minor axis [latex](-5, 4)[/latex], [latex](-5, 0)[/latex]. Foci at [latex](-5 + \sqrt{21}, 2)[/latex], [latex](-5 - \sqrt{21}, 2)[/latex].
[latex]\dfrac{(x+3)^2}{(5)^2} + \dfrac{(y+4)^2}{(2)^2} = 1[/latex]; Endpoints of major axis [latex](2, -4)[/latex], [latex](-8, -4)[/latex]. Endpoints of minor axis [latex](-3, -2)[/latex], [latex](-3, -6)[/latex]. Foci at [latex](-3 + \sqrt{21}, -4)[/latex], [latex](-3 - \sqrt{21}, -4)[/latex].
Foci [latex](-3, -1 + \sqrt{11})[/latex], [latex](-3, -1 - \sqrt{11})[/latex]
Focus [latex](0, 0)[/latex]
Foci [latex](-10, 30)[/latex], [latex](-10, -30)[/latex]
Center [latex](0, 0)[/latex], Vertices [latex](4, 0)[/latex], [latex](-4, 0)[/latex], [latex](0, 3)[/latex], [latex](0, -3)[/latex], Foci [latex](\sqrt{7}, 0)[/latex], [latex](-\sqrt{7}, 0)[/latex]
Center [latex](0, 0)[/latex], Vertices [latex](\dfrac{1}{9}, 0)[/latex], [latex](-\dfrac{1}{9}, 0)[/latex], [latex](0, \dfrac{1}{7})[/latex], [latex](0, -\dfrac{1}{7})[/latex], Foci [latex](0, \dfrac{4\sqrt{2}}{63})[/latex], [latex](0, -\dfrac{4\sqrt{2}}{63})[/latex]
Center [latex](-3, 3)[/latex], Vertices [latex](0, 3)[/latex], [latex](-6, 3)[/latex], [latex](-3, 0)[/latex], [latex](-3, 6)[/latex], Focus [latex](-3, 3)[/latex]Note that this ellipse is a circle. The circle has only one focus, which coincides with the center.
Center [latex](1, 1)[/latex], Vertices [latex](5, 1)[/latex], [latex](-3, 1)[/latex], [latex](1, 3)[/latex], [latex](1, -1)[/latex], Foci [latex](1 + 2\sqrt{3}, 1)[/latex], [latex](1 - 2\sqrt{3}, 1)[/latex]
Center [latex](-4, 5)[/latex], Vertices [latex](-2, 5)[/latex], [latex](-6, 4)[/latex], [latex](-4, 6)[/latex], [latex](-4, 4)[/latex], Foci [latex](-4 + \sqrt{3}, 5)[/latex], [latex](-4 - \sqrt{3}, 5)[/latex]
Center [latex](-2, 1)[/latex], Vertices [latex](0, 1)[/latex], [latex](-4, 1)[/latex], [latex](-2, 5)[/latex], [latex](-2, -3)[/latex], Foci [latex](-2, 1 + 2\sqrt{3})[/latex], [latex](-2, 1 - 2\sqrt{3})[/latex]
Center [latex](-2, -2)[/latex], Vertices [latex](0, -2)[/latex], [latex](-4, -2)[/latex], [latex](-2, 0)[/latex], [latex](-2, -4)[/latex], Focus [latex](-2, -2)[/latex]
[latex]\dfrac{x^2}{25} + \dfrac{y^2}{29} = 1[/latex]
[latex]\dfrac{(x-4)^2}{25} + \dfrac{(y-2)^2}{1} = 1[/latex]
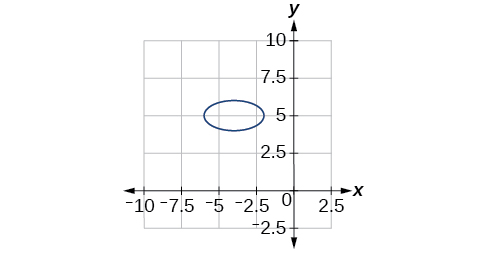
[latex]\dfrac{(x+3)^2}{16} + \dfrac{(y-4)^2}{4} = 1[/latex]
[latex]\dfrac{x^2}{81} + \dfrac{y^2}{9} = 1[/latex]
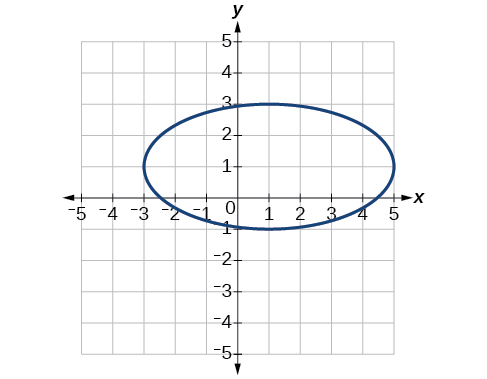
[latex]\dfrac{(x+2)^2}{4} + \dfrac{(y-2)^2}{9} = 1[/latex]
[latex]\dfrac{x^2}{4h^2} + \dfrac{y^2}{1h^2} = 1[/latex]
[latex]\dfrac{x^2}{400} + \dfrac{y^2}{144} = 1[/latex]. Distance = [latex]17.32[/latex] feet
Approximately [latex]51.96[/latex] feet
Hyperbolas
yes; [latex]\dfrac{x^2}{6^2} - \dfrac{y^2}{3^2} = 1[/latex]
yes; [latex]\dfrac{x^2}{4^2} - \dfrac{y^2}{5^2} = 1[/latex]
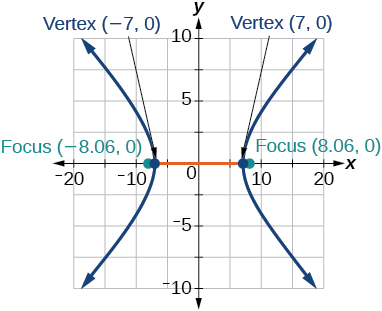
[latex]\dfrac{x^2}{5^2} - \dfrac{y^2}{6^2} = 1[/latex]; vertices: [latex](5, 0)[/latex], [latex](-5, 0)[/latex]; foci: [latex](\sqrt{61}, 0)[/latex], [latex](-\sqrt{61}, 0)[/latex]; asymptotes: [latex]y = \dfrac{6}{5}x[/latex], [latex]y = -\dfrac{6}{5}x[/latex]
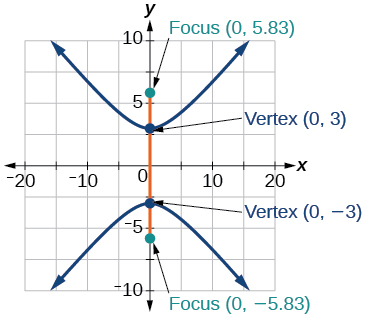
[latex]\dfrac{y^2}{2^2} - \dfrac{x^2}{9^2} = 1[/latex]; vertices: [latex](0, 2)[/latex], [latex](0, -2)[/latex]; foci: [latex](0, \sqrt{85})[/latex], [latex](0, -\sqrt{85})[/latex]; asymptotes: [latex]y = \dfrac{2}{9}x[/latex], [latex]y = -\dfrac{2}{9}x[/latex]
[latex]\dfrac{(x-1)^2}{3^2} - \dfrac{(y-2)^2}{4^2} = 1[/latex]; vertices: [latex](4, 2)[/latex], [latex](-2, 2)[/latex]; foci: [latex](6, 2)[/latex], [latex](-4, 2)[/latex]; asymptotes: [latex]y = \dfrac{4}{3}(x - 1) + 2[/latex], [latex]y = -\dfrac{4}{3}(x - 1) + 2[/latex]
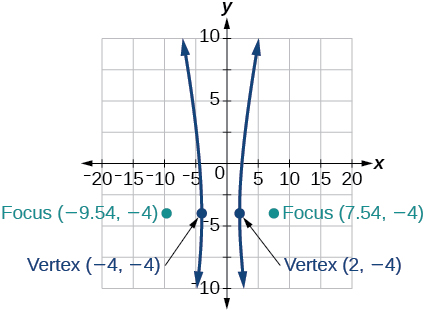
[latex]\dfrac{(x-2)^2}{7^2} - \dfrac{(y+7)^2}{7^2} = 1[/latex]; vertices: [latex](9, -7)[/latex], [latex](-5, -7)[/latex]; foci: [latex](2 + 7\sqrt{2}, -7)[/latex], [latex](2 - 7\sqrt{2}, -7)[/latex]; asymptotes: [latex]y = x - 9[/latex], [latex]y = -x - 5[/latex]
[latex]\dfrac{(x+3)^2}{2^2} - \dfrac{(y-3)^2}{3^2} = 1[/latex]; vertices: [latex](0, 3)[/latex], [latex](-6, 3)[/latex]; foci: [latex](-3 + 3\sqrt{2}, 1)[/latex], [latex](-3 - 3\sqrt{2}, 1)[/latex]; asymptotes: [latex]y = x + 6[/latex], [latex]y = -x[/latex]
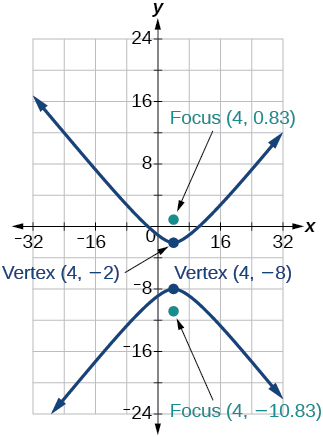
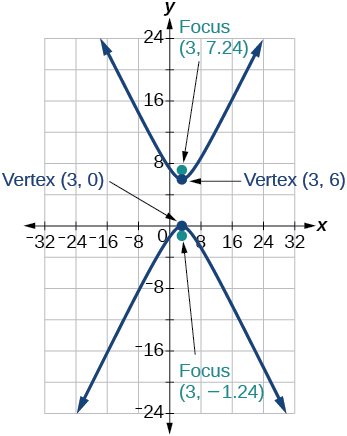
[latex]\dfrac{(y-4)^2}{2^2} - \dfrac{(x-3)^2}{4^2} = 1[/latex]; vertices: [latex](3, 6)[/latex], [latex](3, 2)[/latex]; foci: [latex](3, 4 + 2\sqrt{5})[/latex], [latex](3, 4 - 2\sqrt{5})[/latex]; asymptotes: [latex]y = \dfrac{1}{2}(x - 3) + 4[/latex], [latex]y = -\dfrac{1}{2}(x - 3) + 4[/latex]
[latex]\dfrac{(y+5)^2}{7^2} - \dfrac{(x+1)^2}{70^2} = 1[/latex]; vertices: [latex](-1, 2)[/latex], [latex](-1, -12)[/latex]; foci: [latex](-1, -5 + 7\sqrt{101})[/latex], [latex](-1, -5 - 7\sqrt{101})[/latex]; asymptotes: [latex]y = \dfrac{1}{10}(x + 1) - 5[/latex], [latex]y = -\frac{1}{10}(x + 1) - 5[/latex]
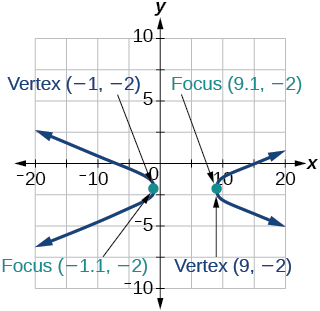
[latex]\dfrac{(x+3)^2}{5^2} - \dfrac{(y-4)^2}{2^2} = 1[/latex]; vertices: [latex](2, 4)[/latex], [latex](-8, 4)[/latex]; foci: [latex](-3 + \sqrt{29}, 4)[/latex], [latex](-3 - \sqrt{29}, 4)[/latex]; asymptotes: [latex]y = \dfrac{2}{5}(x + 3) + 4[/latex], [latex]y = -\dfrac{2}{5}(x + 3) + 4[/latex]
[latex]y = \dfrac{2}{5}(x - 3) - 4[/latex], [latex]y = -\dfrac{2}{5}(x - 3) - 4[/latex]
[latex]y = \dfrac{3}{4}(x - 1) + 1[/latex], [latex]y = -\dfrac{3}{4}(x - 1) + 1[/latex]
[latex]\dfrac{x^2}{9} - \dfrac{y^2}{16} = 1[/latex]
[latex]\dfrac{(x-6)^2}{25} - \dfrac{(y-1)^2}{11} = 1[/latex]
[latex]\dfrac{(x-4)^2}{25} - \dfrac{(y-2)^2}{1} = 1[/latex]
[latex]\dfrac{x^2}{16} - \dfrac{y^2}{25} = 1[/latex]
[latex]\dfrac{y^2}{9} - \dfrac{(x+1)^2}{9} = 1[/latex]
[latex]\dfrac{(x+3)^2}{25} - \dfrac{(y+3)^2}{25} = 1[/latex]
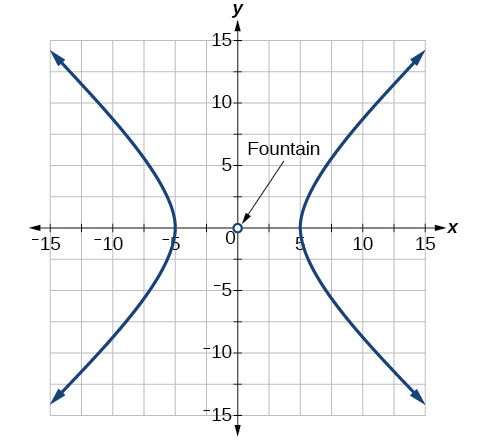
[latex]\dfrac{x^2}{25} - \dfrac{y^2}{25} = 1[/latex]
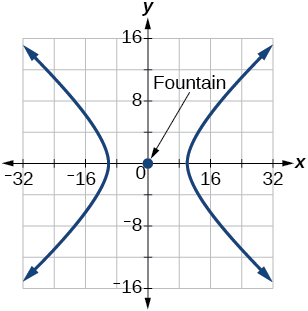
[latex]\dfrac{x^2}{100} - \dfrac{y^2}{25} = 1[/latex]
[latex]\dfrac{x^2}{400} - \dfrac{y^2}{225} = 1[/latex]
[latex]4(x-1)^2 - y2^2 = 16[/latex]
[latex]\dfrac{(x-h)^2}{a^2} - \dfrac{(y-k)^2}{b^2} = (x-3)^2 - 9y^2 = 4[/latex]
Parabolas
yes [latex]x^2 = 4(\dfrac{1}{16})y[/latex]
yes [latex](y-3)^2 = 4(2)(x-2)[/latex]
[latex]y^2 = \dfrac{1}{8}x[/latex], V: [latex](0,0)[/latex]; F: [latex](\dfrac{1}{32},0)[/latex]; d: [latex]x = -\dfrac{1}{32}[/latex]
[latex]x^2 = -\dfrac{1}{4}y[/latex], V: [latex](0,0)[/latex]; F: [latex](0,-\dfrac{1}{16})[/latex]; d: [latex]y = \dfrac{1}{16}[/latex]
[latex]y^2 = \dfrac{1}{36}x[/latex], V: [latex](0,0)[/latex]; F: [latex](\dfrac{1}{144},0)[/latex]; d: [latex]x = -\dfrac{1}{144}[/latex]
[latex](x-1)^2 = 4(y-1)[/latex], V: [latex](1,1)[/latex]; F: [latex](1,2)[/latex]; d: [latex]y = 0[/latex]
[latex](y-4)^2 = 2(x+3)[/latex], V: [latex](-3,4)[/latex]; F: [latex](-\dfrac{5}{2},4)[/latex]; d: [latex]x = -\dfrac{7}{2}[/latex]
[latex](x+4)^2 = 24(y+1)[/latex], V: [latex](-4,-1)[/latex]; F: [latex](-4,5)[/latex]; d: [latex]y = -7[/latex]
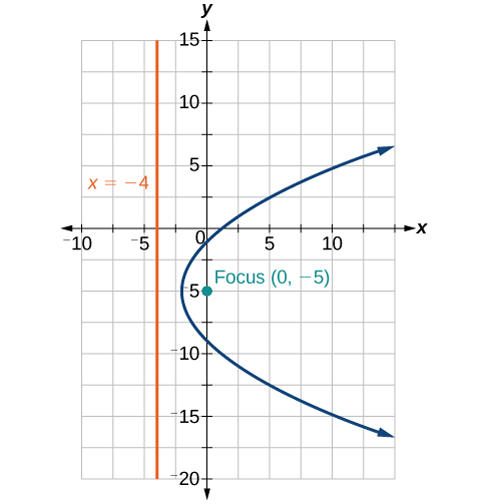
[latex](y-3)^2 = -12(x+1)[/latex], V: [latex](-1,3)[/latex]; F: [latex](-4,3)[/latex]; d: [latex]x = 2[/latex]
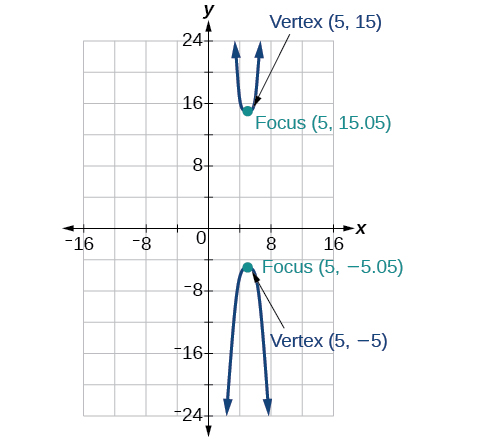
[latex](x-5)^2 = \dfrac{8}{5}(y+3)[/latex], V: [latex](5,-3)[/latex]; F: [latex](5,-\dfrac{14}{5})[/latex]; d: [latex]y = -\dfrac{16}{5}[/latex]
[latex](x-2)^2 = -2(y-5)[/latex], V: [latex](2,5)[/latex]; F: [latex](2,\dfrac{9}{2})[/latex]; d: [latex]y = \dfrac{11}{2}[/latex]
[latex](y-1)^2 = \dfrac{4}{3}(x-5)[/latex], V: [latex](5,1)[/latex]; F: [latex](\dfrac{16}{3},1)[/latex]; d: [latex]x = \dfrac{14}{3}[/latex]
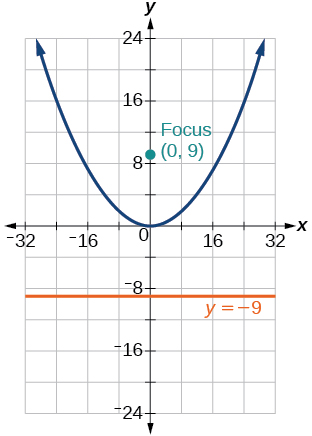
[latex]x^2 = -16y[/latex]
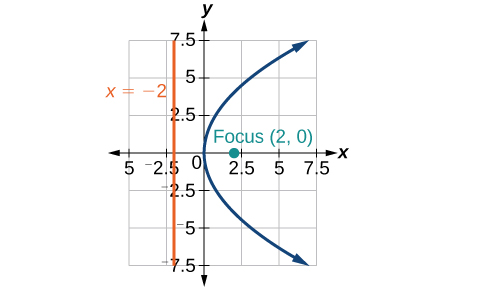
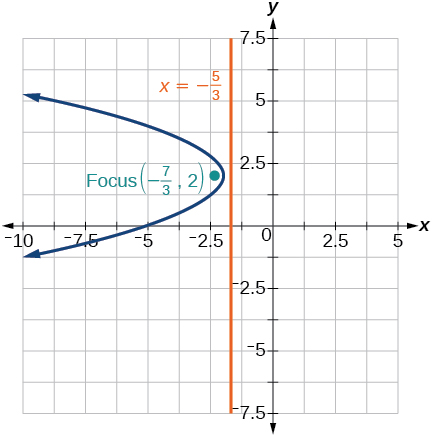
[latex](y-2)^2 = 4\sqrt{2}(x-2)[/latex]
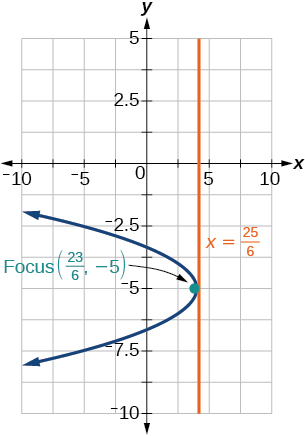
[latex](y+\sqrt{3})^2 = -4\sqrt{2}(x-\sqrt{2})[/latex]
[latex]x^2 = y[/latex]
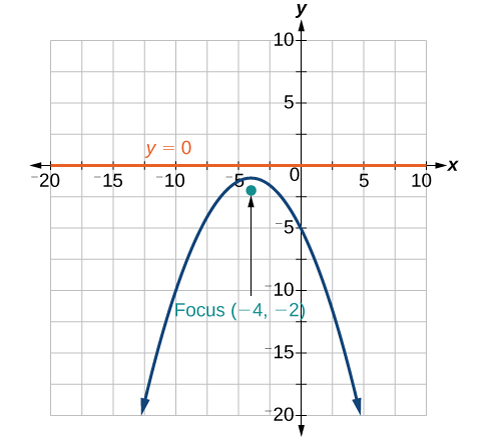
[latex](y-2)^2 = \dfrac{1}{4}(x+2)[/latex]
[latex](y-\sqrt{3})^2 = 4\sqrt{5}(x+\sqrt{2})[/latex]
[latex](0,1)[/latex]
At the point [latex]2.25[/latex] feet above the vertex.
[latex]0.5625[/latex] feet
[latex]x^2 = -125(y-20)[/latex], height is [latex]7.2[/latex] feet
[latex]2304[/latex] feet
Previous/next navigation