- Recognize when a one-sample [latex]z[/latex]-test or a two-sample [latex]z[/latex]-test is needed to answer a research question.
- Complete a two-sample [latex]z[/latex]-test for proportions from hypotheses to conclusions.
Two-Sample Hypothesis Test for Proportions
As mentioned before, hypothesis testing is part of inference. We previously stated that the purpose of a hypothesis test is to use sample data to test a claim about a population parameter. However, studies often compare two groups. Comparing two proportions is quite common. A hypothesis test can help determine if a difference in the estimated proportions reflects a difference in the population proportions.
two-sample [latex]z[/latex]-test of proportions
- Write out the null and alternative hypotheses.
- Null hypothesis: [latex]H_0: p_1=p_2[/latex] or [latex]H_0: p_1-p_2=0[/latex]
- Alternative hypothesis:
- [latex]H_A: p_1\lt p_2[/latex] or [latex]H_A: p_1-p_2\lt 0[/latex]
- [latex]H_A: p_1>p_2[/latex] or [latex]H_A: p_1-p_2>0[/latex]
- [latex]H_A: p_1\ne p_2[/latex] or [latex]H_A: p_1-p_2\ne0[/latex]
- Check the conditions for the hypothesis test. For testing a two-sample [latex]z[/latex]-test for proportions, we require:
- Large Counts: For [latex]\hat{p}_c = \frac{x_1+x_2}{n_1+n_2}[/latex], check that: [latex]n_1\hat{p}_c \ge 10[/latex], [latex]n_2\hat{p}_c \ge 10[/latex], [latex]n_1(1-\hat{p}_c) \ge 10[/latex], and [latex]n_2(1-\hat{p}_c) \ge 10[/latex].
- Random Samples/Assignment: Check that the two samples are independent and random samples or that they come from randomly assigned groups in an experiment.
- 10%: Check that [latex]n_1<0.10(N_1)[/latex] and [latex]n_2<0.10(N_2)[/latex].
- Calculate a test statistic.
- Calculate a P-value.
- Compare the P-value to the significance level, [latex]\alpha[/latex], to make a decision.
Decision Conclusion If P-value [latex]\le\alpha[/latex], there is enough evidence to reject the null hypothesis. At the [latex]\alpha\times[/latex]100% significance level, the data provide convincing evidence in support of the alternative hypothesis. If P-value [latex]\gt\alpha[/latex], there is not enough evidence to reject the null hypothesis. At the [latex]\alpha\times[/latex]100% significance level, the data do not provide convincing evidence in support of the alternative hypothesis. - Write a conclusion in context (e.g., we do/do not have convincing evidence…).
[Trouble viewing? Click to open in a new tab.]
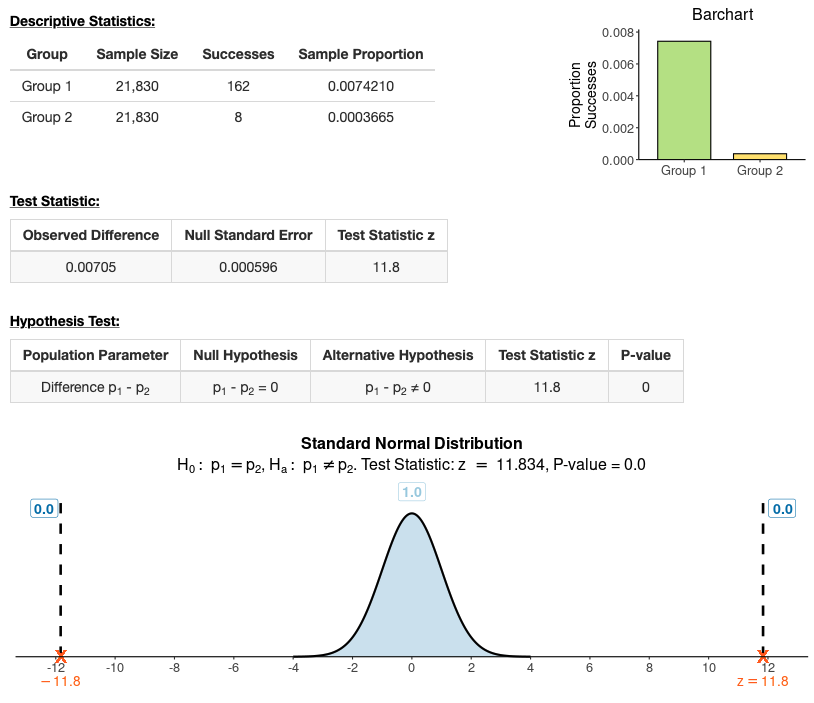
The [latex]43,660[/latex] subjects were split evenly between the placebo and vaccine groups (about [latex]21,830[/latex] subjects per group). In the placebo group — the group that got a “fake” vaccine — [latex]162[/latex] became infected with the coronavirus and showed symptoms. In the vaccine group — the group that got the real vaccine — that number was only eight. At the [latex]5\%[/latex] significance level, is the vaccine group’s infection risk that different from the placebo group’s?
- https://www.nytimes.com/2020/12/13/learning/what-does-95-effective-mean-teaching-the-math-of-vaccine-efficacy.html ↵