- Select a simple random sample from a finite population
- Understand and apply different sampling methods
- Determine and explain bias in a sampling method
- The population is an entire group of people, objects, or animals; usually a large group.
- A sample is a selected subset or subgroup of a population.
- For statistics, we want our sample to be representative of the population so we can make accurate inferences.
Sampling Methods
There are five common sampling methods used in research. These sampling methods include:
- simple random sampling
- systematic sampling
- stratified sampling
- cluster sampling
- convenience sampling
Simple Random Samples
In simple random sampling, every sample of a given size has the same chance of being selected. This results in every individual or entity of the population having an equal chance of being selected. There are different ways to collect a simple random sample, such as using a random number generator, placing equal-sized slips of paper in a hat and drawing a sample, rolling a six-sided die, or any other event where each outcome is assigned a subject and each subject has an equally likely chance of being selected.
Random Number Generator
A simple random sample relies on a random mechanism to choose a sample, without replacement, from the population so that every sample is equally likely to be chosen. Consider choosing 10 states randomly from the 50 United States.
STEP 1: Under “Choose Minimum,” select “1.”
STEP 2: Under “Choose Maximum,” select “50.”
STEP 3: Under “How many numbers do you want to generate,” select “10.”
STEP 4: Under “Sample with Replacement,” select “No.”
STEP 5: Click “Generate.” This will generate ten random numbers between 1 and 50.
Save these 10 numbers for the next question.
[Trouble viewing? Click to open in a new tab.]
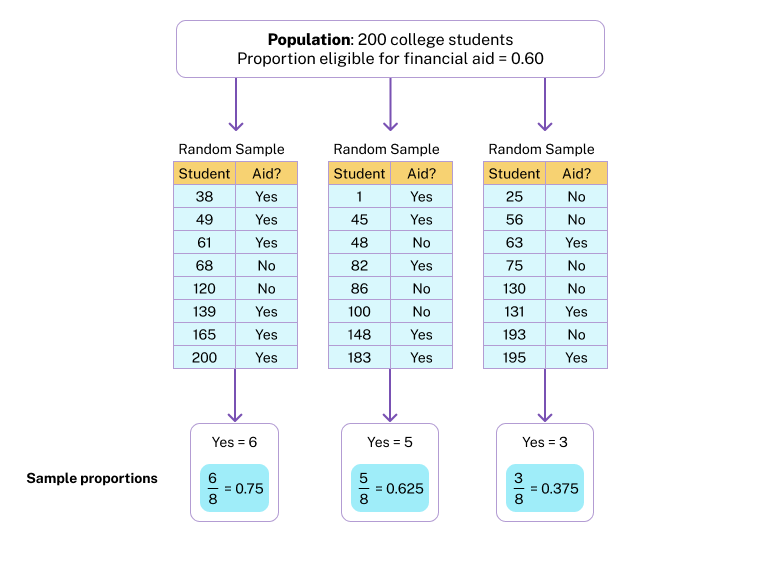
Consider a small college with only 200 students, where 60% of these students were eligible for financial aid.
We can use this simplified situation to investigate how random samples relate to the population. This is the first step in creating a probability model that will be useful in inference. We know the truth about the whole population (60% get aid). But in real life, we usually don’t know the whole population; we only see a sample. So the question we want to ask is:
How accurate are random samples at predicting this population proportion of 0.60?
To answer this question, we randomly select 8 students and determine the proportion who are eligible for financial aid. We repeat this process several times. Here are the results for 3 random samples: