- Use technology to create a sampling distribution of a sample proportion given [latex]n[/latex] and [latex]p[/latex].
- Calculate the mean and standard deviation for a sampling distribution of a sample proportion.
- Recognize the difference between the standard deviation and the standard error of a sample proportion.
Sampling Distribution of a Sample Proportion
In order to get a sense of the pattern of variation in sample proportions, we need to generate more than five samples.
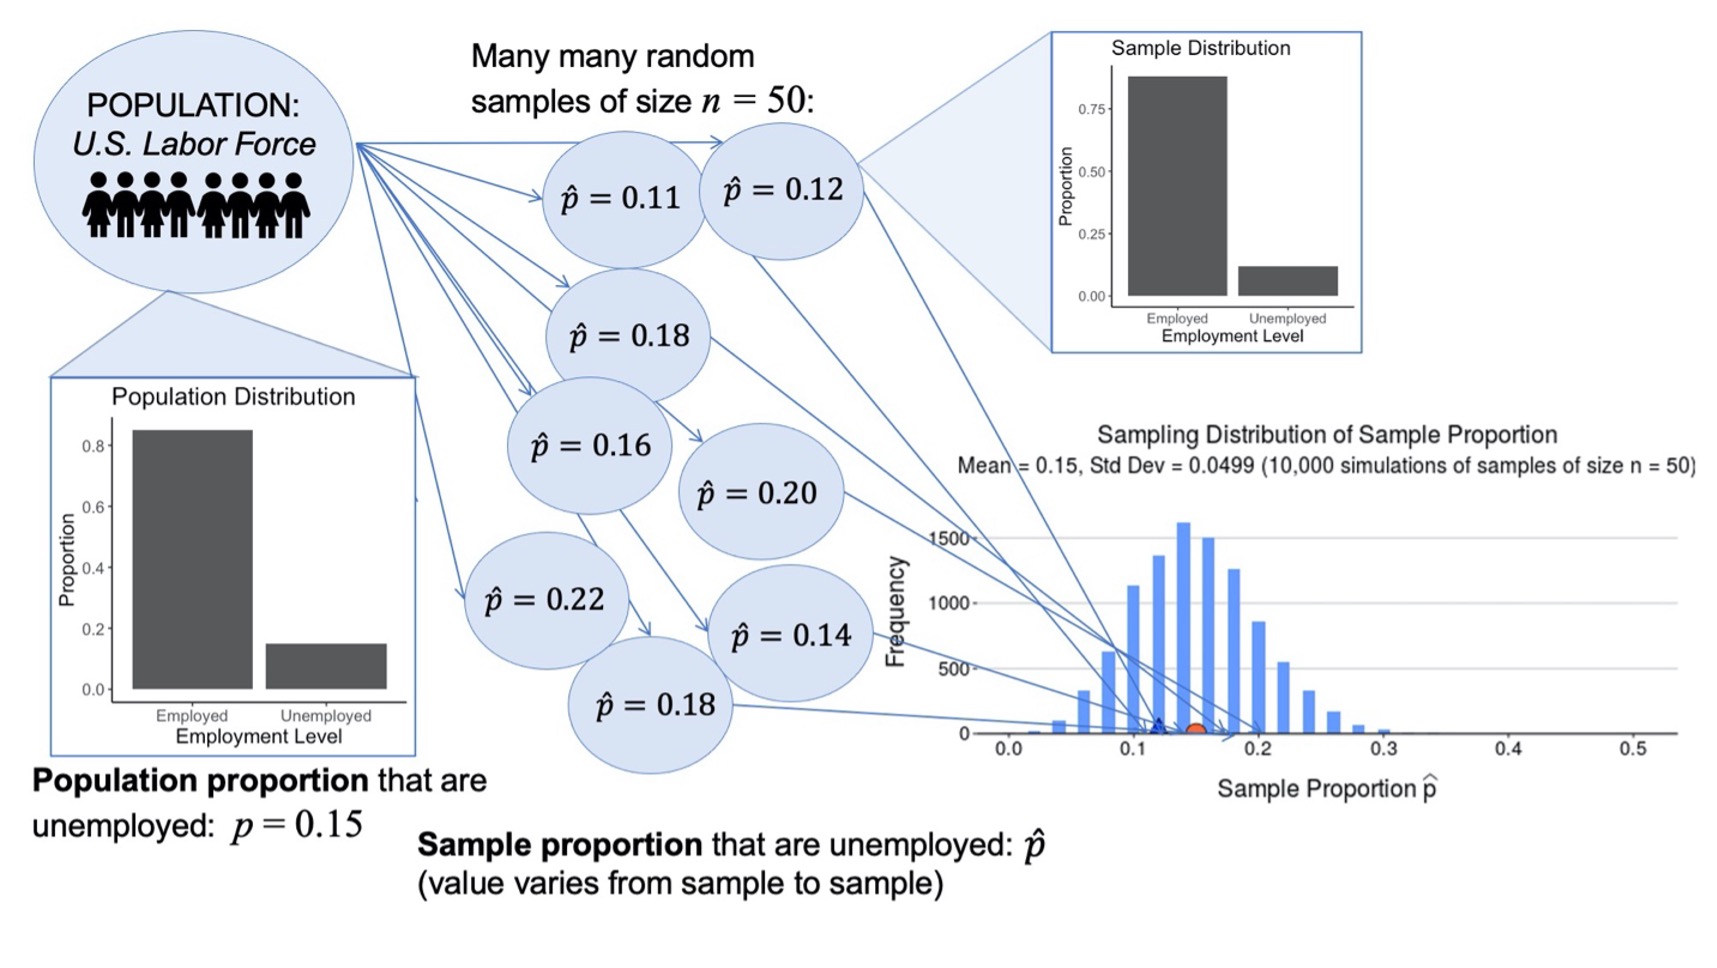
In statistics, we often talk about distributions. A sampling distribution is just a distribution of sample statistics as they vary from sample to sample. An illustration of the distinction between the population distribution of the variable, a single sample distribution of the variable, and the sampling distribution of sample proportions is shown below using unemployment data.