- Learn how to construct and interpret a tree diagram to represent sequential events or decisions
- Calculate conditional probabilities using tree diagrams, considering both dependent and independent events
- Apply tree diagrams to solve problems involving probability of multiple events, such as probability of compound events and conditional probability
A very natural use of tree diagrams is to help visualize conditional probability for compound events.
conditional probability
The conditional probability of [latex]B[/latex] given [latex]A[/latex] is denoted as [latex]P(B\text{ given }A) = P(B|A).[/latex]
[latex]P(B\text{ given }A) = P(B|A)[/latex] is the probability that event [latex]B[/latex] will occur given that the event [latex]A[/latex] has already occurred.
In a tree diagram, conditional probability focuses on a specific branch of this tree, considering that a particular event has already happened.
In mathematical terms, if [latex]P(A)[/latex] represents the probability of event [latex]A[/latex], and [latex]P(B)[/latex] represents the probability of event [latex]B[/latex], the conditional probability of [latex]B[/latex] given that event [latex]A[/latex] has occurred is denoted as [latex]P(B|A)[/latex], and it is calculated as:
Utilizing the tree diagram allows us to intuitively grasp conditional probability!
By using the tree diagram, we can visualize the conditional probability [latex]P(B\text{ given } A)[/latex] by analyzing a particular route within the tree. So, when we consider events [latex]A[/latex] and [latex]B[/latex], we can interpret the conditional probability [latex]P(B\text{ given } A)[/latex] by first tracing the path associated with event [latex]A[/latex] and then determining the probability associated with the subsequent path leading to event [latex]B[/latex].
Suppose 10 marbles were placed in a bag with 4 being blue and 6 being red. Suppose two marbles were consecutively drawn without replacement from the bag.
The tree diagram for the given scenario is given below.
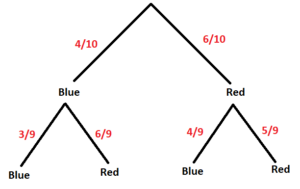
Let’s calculate the following conditional probability!
(a) If a red was drawn first, what is the probability that the second draw was blue?
(b) If a blue was drawn first, what is the probability that the second draw is red?
(c) If a blue was drawn first, what is the probability that the second draw is also blue?