- Learn how to construct and interpret a tree diagram to represent sequential events or decisions
- Calculate conditional probabilities using tree diagrams, considering both dependent and independent events
- Apply tree diagrams to solve problems involving probability of multiple events, such as probability of compound events and conditional probability
Tree Diagram
A tree diagram is a graphical representation of a series of events or decisions. It’s often used in probability theory to calculate outcomes and understand the potential paths of different events. The diagram starts with a single event or decision represented as a node. From this node, branches extend out, each representing a possible outcome of the event or decision.
Each branch may lead to further events or decisions, represented as additional nodes, and more branches extend from these nodes, showing the possible outcomes of those events. This branching structure continues until all relevant events and outcomes are represented.
Tree diagrams are particularly useful for understanding the sequence of events and calculating probabilities associated with different outcomes. They provide a clear visual representation of complex scenarios, making it easier to grasp the potential combinations and probabilities involved.
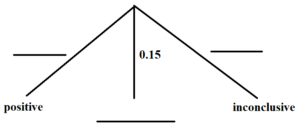
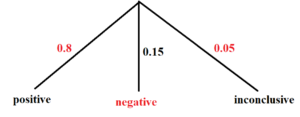
A polygraph test is commonly used to determine whether suspects might be lying to hide their criminal activity. Larry, a well-known liar, underwent the test as a way to prove his innocence. The test has an 80% success rate in detecting a lie, a 15% chance of not detecting a lie, and a 5% chance of yielding an inconclusive result.
Let [latex]A=[/latex] “test is positive for lying”, [latex]B=[/latex] “test is negative for lying “, and [latex]C=[/latex] “test is inconclusive”.
Fill in the missing parts of tree diagram using the information provided.
Using the tree diagram, answer the following questions.
(a) What is the sample space [latex]S[/latex] based on the probability tree?
(b) What is the probability that the polygraph test was positive?
(c) What is the probability that the polygraph test was not positive?
In a tree diagram, probabilities are multiplied along the branches to find the probability at the end of a branch due to the Multiplication Rule of Probability. This rule states that the probability of the occurrence of multiple independent events is found by multiplying the probabilities of each individual event.
A litter of kittens available for adoption at the Humane Society has four tabby kittens and five black kittens. A family comes in and randomly selects two kittens (without replacement) for adoption.

- What is the probability that both kittens are tabby?
What is the probability that one kitten of each coloring is selected?- What is the probability that a tabby is chosen as the second kitten when a black kitten was chosen as the first?
- What is the probability of choosing two kittens of the same color?