- Understand the concept of set theory and how it relates to probability
- Create and interpret Venn diagrams to visually represent sets and their intersections
- Understand how to use Venn diagrams to solve problems related to probability, including union, intersection, and complement of events
intersection of events
The intersection of two events, [latex]A[/latex] and [latex]B[/latex], is denoted by [latex]A \cap B[/latex].
[latex]A[/latex] and [latex]B[/latex] means that all elements in event [latex]A[/latex] also belong in event [latex]B[/latex] or equivalently, all elements of [latex]B[/latex] is also in event [latex]A[/latex].
In terms of probability, [latex]P(A \text{ and }B)= P(A \cap B)=[/latex] the relative frequency of event [latex]A[/latex] and [latex]B[/latex] with respect to the sample space.
Consider the set [latex]A = \{\text{red}, \text{blue}, \text{green}\}[/latex] and [latex]B=\{\text{red},\text{yellow},\text{orange}\}[/latex].
The event [latex]A \cap B = \{\text{red}\}[/latex].
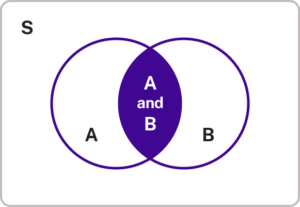
Using Venn diagrams, we can imagine AND events as the region where two events overlap. This is represented by the colored region in the Venn diagram below where two circles representing events [latex]A[/latex] and [latex]B[/latex] intersect.
(a) Create a Venn diagram using the information given where C = “the event the participant attends college” and W = “the event the participant is working”.
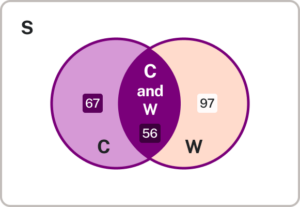
(b) What is the probability that the participant is attending college and working?
union of events
The union of two events, [latex]A[/latex] or [latex]B[/latex], is denoted by [latex]A \cup B[/latex].
The union of two events consists of the set of all elements in the collection of both events. The outcomes in the event [latex]A[/latex] or [latex]B[/latex] are the outcomes that are in event [latex]A[/latex], in event [latex]B[/latex], or in both event [latex]A[/latex] and event [latex]B[/latex].
In term of probability, [latex]P(A \text{ or }B)= P(A \cup B)=[/latex] the relative frequency of either event [latex]A[/latex] or [latex]B[/latex] (or both) with respect to the sample space.
Consider the set [latex]A = \{\text{red}, \text{blue}, \text{green}\}[/latex] and [latex]B=\{\text{red},\text{yellow},\text{orange}\}[/latex].
The event [latex]A \cup B = \{\text{red}, \text{blue}, \text{green}, \text{yellow}, \text{orange}\}[/latex].
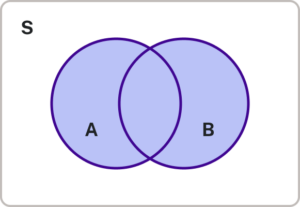
Once again, we can utilize the Venn diagram to represent this as two events [latex]A[/latex] and [latex]B[/latex] with both circles (and their intersection) being entirely shaded as shown below.
mutually exclusive events
Mutually exclusive describes two or more events that cannot happen simultaneously.
If event [latex]A[/latex] and event [latex]B[/latex] are mutually exclusive, then [latex]A \cap B[/latex] is an empty set and [latex]P(A \cap B) = 0[/latex].
Therefore,
[latex]P(A \text{ or } B) = P(A \cup B) = P(A)+P(B)[/latex]
Using Venn diagrams, we can also visualize the concept of mutually exclusive or disjoint events as non-intersecting circles as shown below.
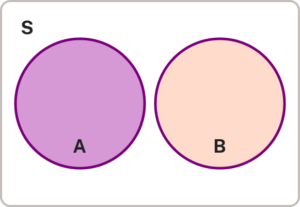
When we find probability [latex]P(A \text{ or } B)[/latex] for mutually exclusive events, we would consider the shaded region of both circles without any intersection.