- Understand the concept of set theory and how it relates to probability
- Create and interpret Venn diagrams to visually represent sets and their intersections
- Understand how to use Venn diagrams to solve problems related to probability, including union, intersection, and complement of events
Venn Diagrams
To visualize the interaction of sets, John Venn in 1880 thought to use overlapping circles, building on a similar idea used by Leonhard Euler in the 18th century. These illustrations now called Venn Diagrams.
A Venn diagram is a visual representation that illustrates the outcomes of a chance experiment.
Venn diagrams
A Venn diagram represents each set by a circle/oval, usually drawn inside of a containing box representing the sample space. Overlapping areas indicate elements common to both sets.
Basic Venn diagrams can illustrate the interaction of two or three sets.
To track the outcomes for a specific event, it is useful to indicate the number of outcomes (or proportions) that correspond to that event inside the Venn diagram.
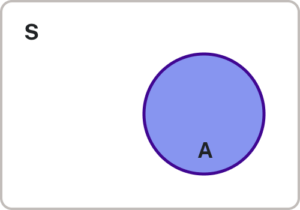
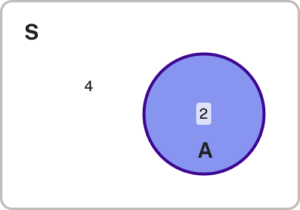
(a) How many possible outcomes are there in the sample space of [latex]S[/latex]?
(b) How many outcomes correspond to the event of [latex]A[/latex]?
(c) Draw the Venn diagram with the number of outcomes for each event in the sample space.
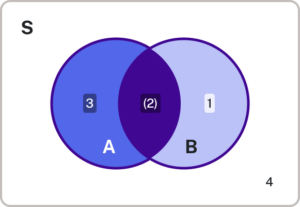
There are cases where we might have to consider chance experiments involving multiple events. In such situations, we need to use multiple circles to represent each event. In some special cases, events can overlap, and in these instances, we represent them as intersecting circles, with the counts inside each circle adjusted to account for the overlap.
Consider[latex]S=\{1,2,3,4,5,6,7,8,9,10\}[/latex]
Let [latex]A =[/latex] “the number is even” and [latex]B =[/latex] “the number is at least 8”.
(a) How many possible outcomes are there in the sample space of [latex]S[/latex]?
(b) How many outcomes correspond to the event of [latex]A[/latex]?
(c) How many outcomes correspond to the event of [latex]B[/latex]?
(d) Draw the Venn diagram with the number of outcomes for each event in the sample space.