- Understand the concept of set theory and how it relates to probability
- Create and interpret Venn diagrams to visually represent sets and their intersections
- Understand how to use Venn diagrams to solve problems related to probability, including union, intersection, and complement of events
Venn Diagram
A Venn diagram is a picture that represents the outcomes of an experiment. It generally consists of a box that represents the sample space S together with circles or ovals. The circles or ovals represent events.
Let’s create Venn diagrams to illustrate A ⋃ B, A ⋂ B, and [latex]A^c[/latex] ⋂ B .
A ⋃ B contains all elements in either set.

A ⋂ B contains only those elements in both sets – in the overlap of the circles.

[latex]A^c[/latex] will contain all elements not in the set A. [latex]A^c[/latex] ⋂ B will contain the elements in set B that are not in set A.

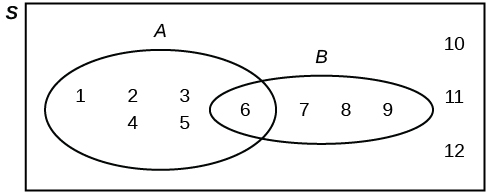
Suppose an experiment has the outcomes [latex]1, 2, 3, ..., 12[/latex] where each outcome has an equal chance of occurring.
Let event [latex]A = \{1,2,3,4,5,6\}[/latex] and [latex]B = \{6,7,8,9\}[/latex].
Then, [latex]A \text{ and } B = \{6\}[/latex] and [latex]A \text{ or } B = \{1,2,3,4,5,6,7,8,9\}[/latex]
The Venn diagram is as follows:
We can also fill out Venn diagram using the counts the events rather than listing the elements. This will help in calculating the probability afterward.
For example, suppose you gave a survey and found that 15 people liked only dogs, 10 people liked only cats, and 40 people liked both dogs and cats. The Venn diagram would consist of two circles, one labeled dogs and one labeled cats.

Notice that if you look at the set of those who like dogs, you will see there are 15 who like dogs only, and 40 who like both. The total number of people who like dogs is the sum of 15 and 40, which is 55.

Likewise, if you look at the set of those who like cats, you will see there are 10 who like cats only, and 40 who like both. The total number of people who like cats is the sum of 40 and 10, which is 50.

Calculating Probabilities
Forty percent of the students at a local college belong to a club, and fifty percent work part-time. Five percent of the students work part-time and belong to a club.
Let’s draw a Venn diagram showing the relationships.
Let C = student belongs to a club and PT = student works part-time.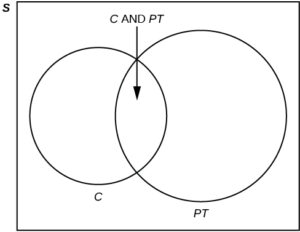
Fill in the necessary parts of the Venn diagram and then use the information to find the following probabilities:
(a) [latex]P(C)[/latex]
(b) [latex]P(PT)[/latex]
(c) [latex]P(C \cap PT)[/latex]
(d) [latex]P(C \cup PT)[/latex]
(e) [latex]P(C \text{ but not } PT)[/latex]
(f) Are the events [latex]C[/latex] and [latex]PT[/latex] mutually exclusive?