- Understand the concept of a probability distribution and its role in describing the behavior of a random variable.
- Describe the characteristics of probability distributions.
Boreal owls are common in Canada and Alaska. They are fairly small, averaging [latex]10[/latex] inches in length and weighing from [latex]4[/latex] to [latex]6[/latex] oz. They often make their nests in woodpecker holes. The number of eggs in a boreal owl nest generally ranges from [latex]4[/latex] to [latex]6[/latex] eggs. Using relative frequencies from large field observations, we can estimate the probability of a nest containing a certain number of eggs.
The variable is the number of Boreal owl eggs in a nest.
This is a quantitative variable with values [latex]0, 1, 2, 3, 4, 5,[/latex] or [latex]6[/latex] eggs.
The probability distribution gives the probability that a nest will have from [latex]0[/latex] to [latex]6[/latex] eggs.
| Number of Eggs | Probability |
|---|---|
| [latex]0[/latex] | [latex]0.2[/latex] |
| [latex]1[/latex] | [latex]0.1[/latex] |
| [latex]2[/latex] | [latex]0.1[/latex] |
| [latex]3[/latex] | [latex]0.25[/latex] |
| [latex]4[/latex] | [latex]0.25[/latex] |
| [latex]5[/latex] | [latex]0.05[/latex] |
| [latex]6[/latex] | [latex]0.05[/latex] |
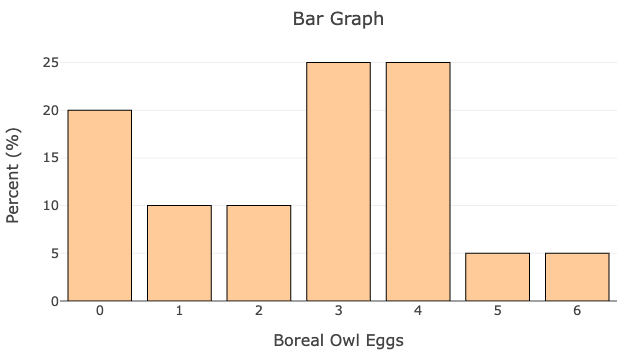
This table and bar graph are an example of a probability distribution. Each variable value is assigned a probability.
Note: The sum of all of the probabilities is [latex]1[/latex]. This is always true for a probability distribution.
We can use the probability distribution to answer probability questions:
Question: Which is more likely: (1) To find a boreal owl nest with [latex]3[/latex] eggs, or (2) To find a boreal owl nest with [latex]4[/latex] eggs.
Question: Do the data points in the probability distribution follow a specific pattern or distribution shape, such as uniform, symmetric, or skewed? What can you say about the mean and median values of the probability distribution? How does this balance between the mean and median affect our understanding of the distribution’s central tendencies and symmetry?