- Complete a one-sample [latex]z[/latex]-test for proportions from hypotheses to conclusions.
- Use a P-value to explain the conclusions of a completed [latex]z[/latex]-test for proportions.
P-value
At what point in data collection and testing does the test statistic seem unusual? How do we measure “unusual?” In a statistical hypothesis test, the evidence used is probability.
P-value
We define the P-value as the probability of obtaining a test statistic at least as extreme (in the direction of the alternative hypothesis) as the one that is actually seen if the null hypothesis is true.
The statistical evidence that we gather is always evidence in support of the alternative hypothesis and against the null hypothesis. We ask ourselves the question, “Do we have enough evidence to reject the null hypothesis?” The P-value answers the question: “How unlikely is the sample data given that the null hypothesis is true?”
Consider a hypothesis test with a test statistic of [latex]z=1[/latex]. The P-value is the area under the curve of the standard normal distribution in the direction of the alternative hypothesis:
| If [latex]H_a: p \lt z^*[/latex] | If [latex]H_a: p> z^*[/latex] | If [latex]H_a: p\ne z^*[/latex] |
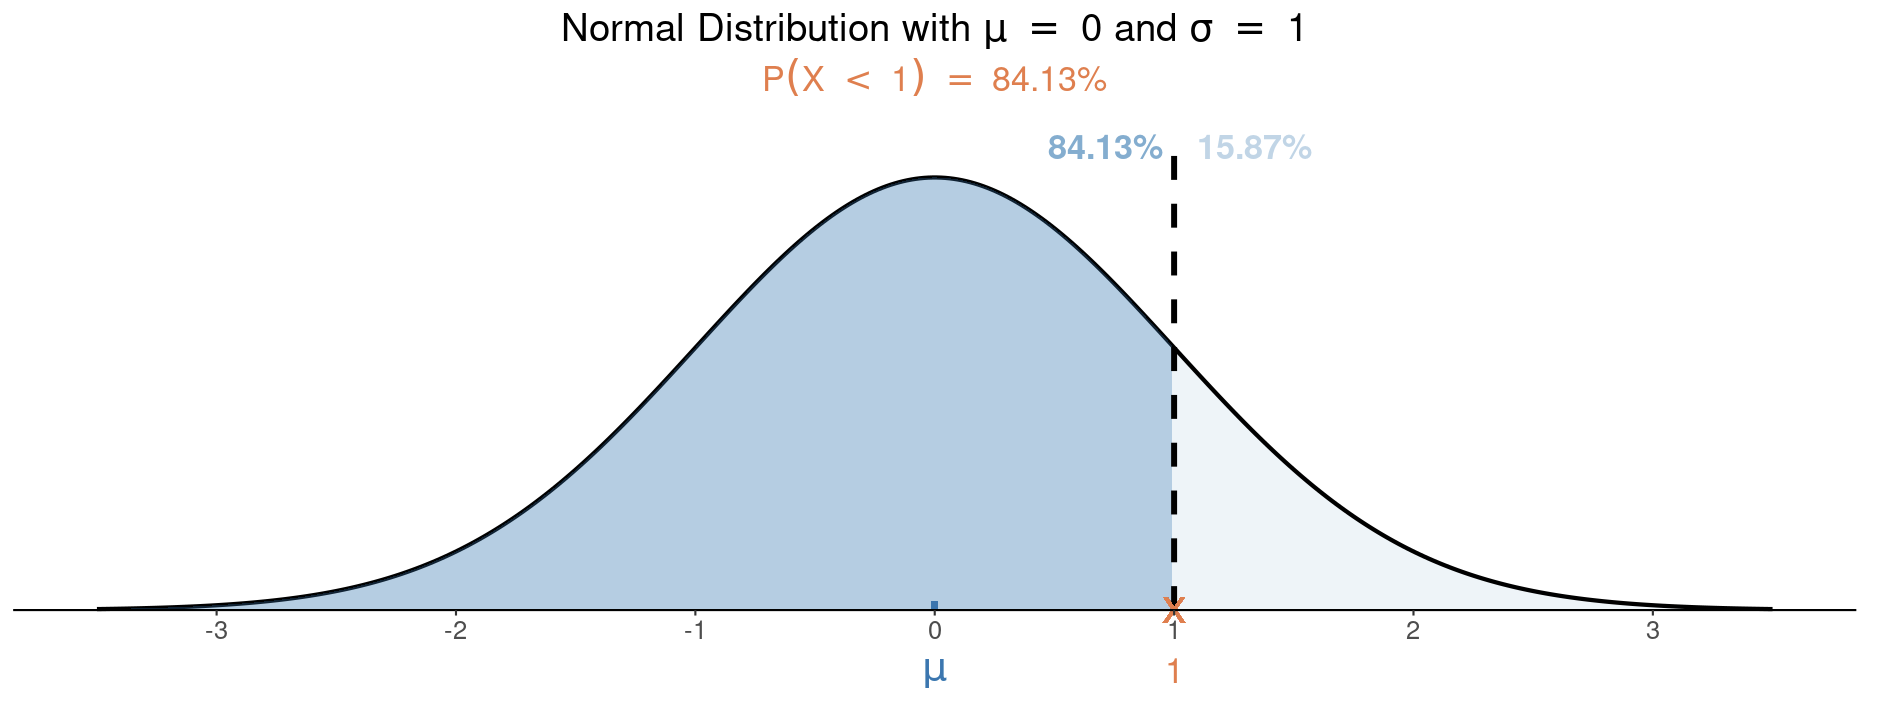 |
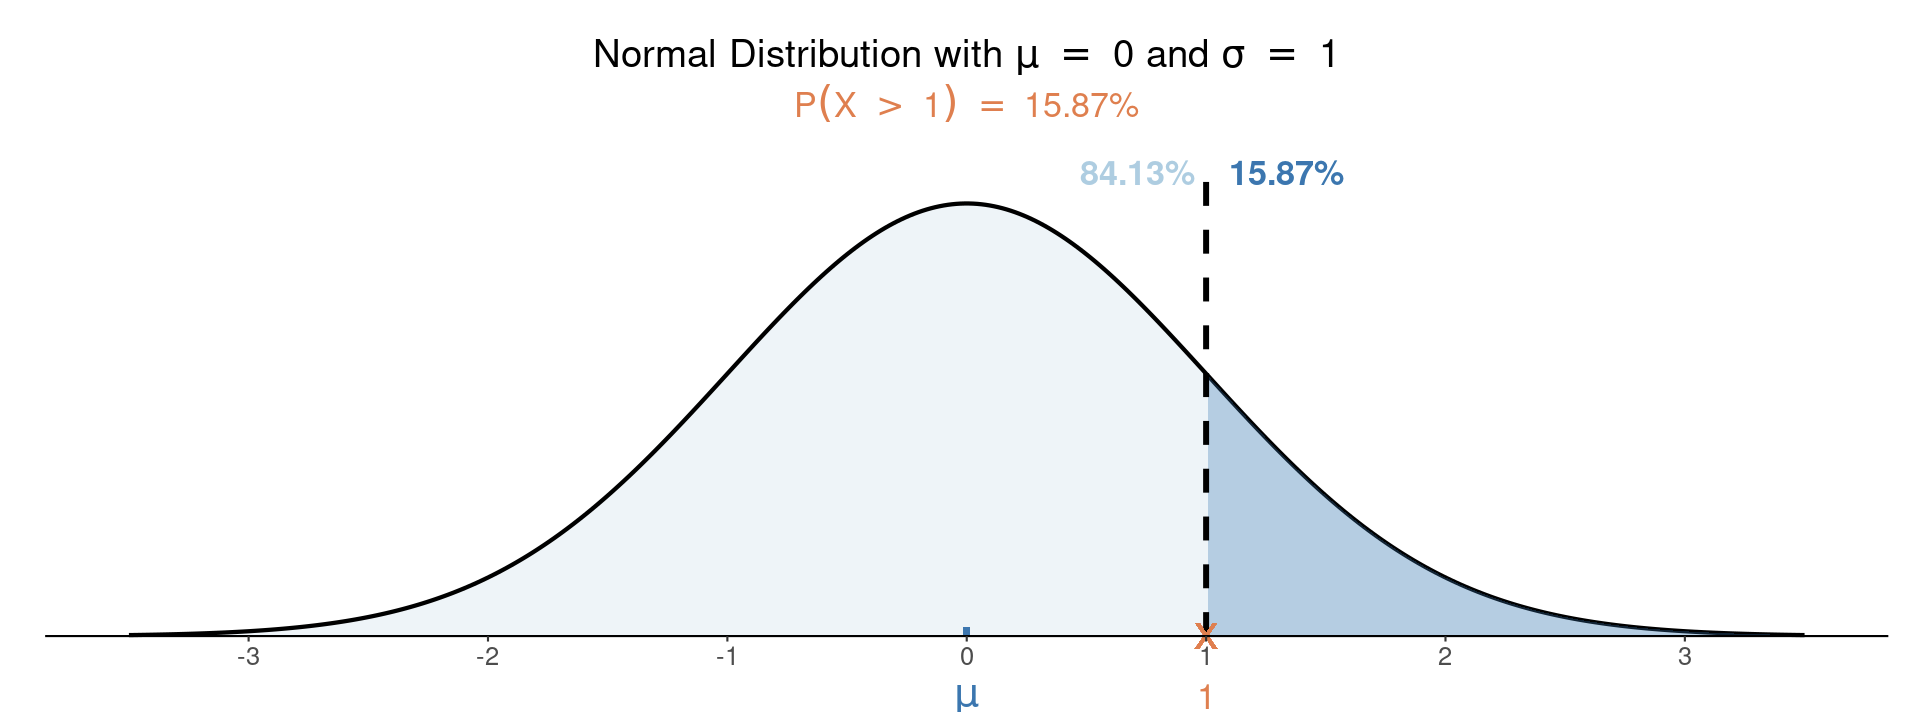 |
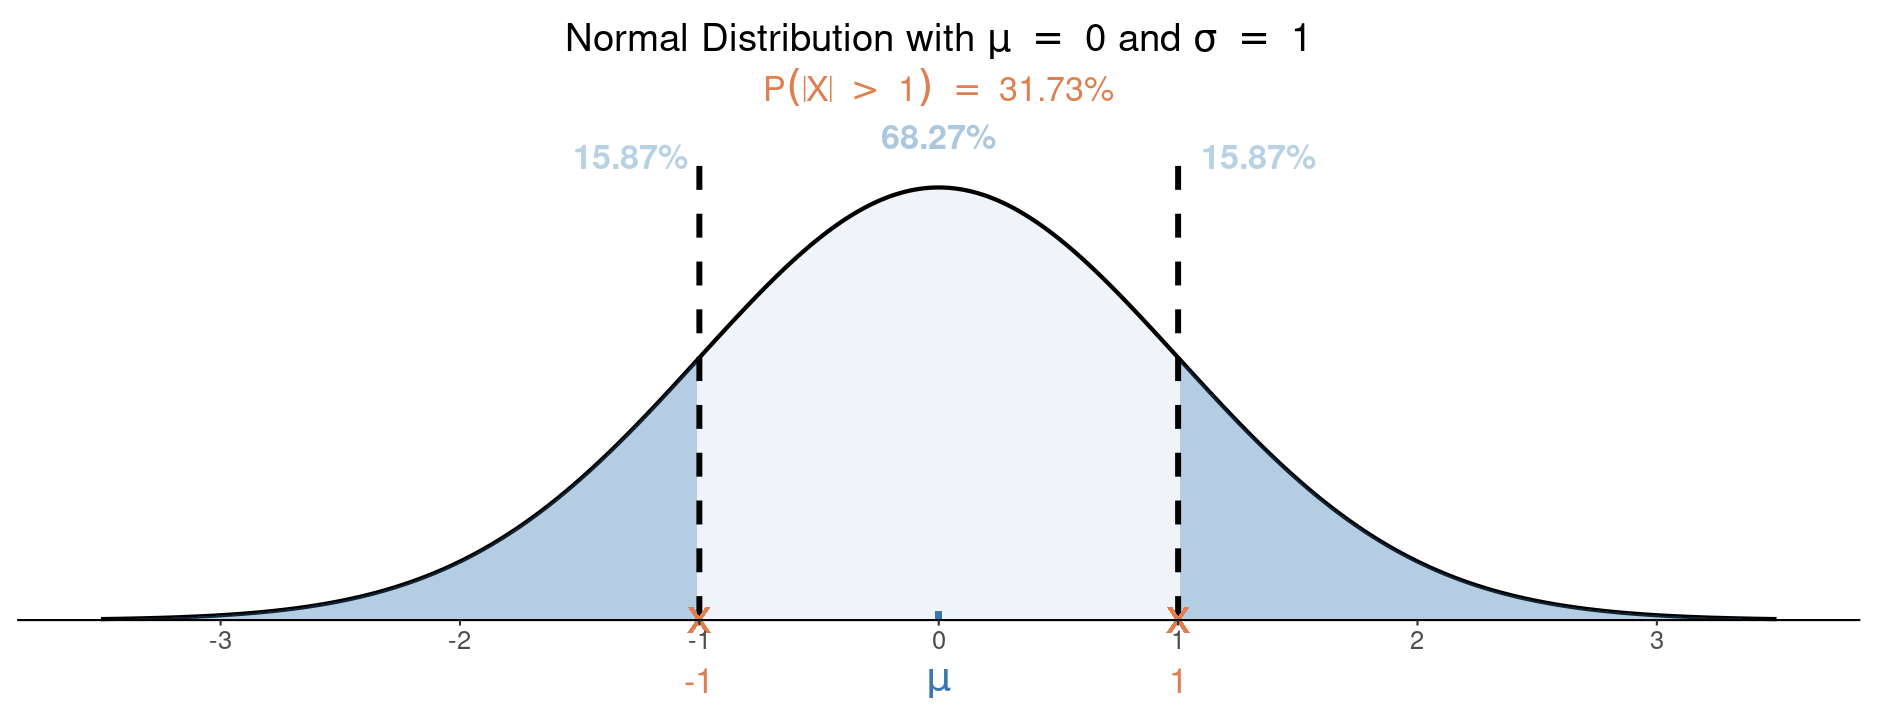 |
| P-value = [latex].8413[/latex] | P-value = [latex].1587[/latex] | P-value = [latex].3173[/latex] |
The P-value is the probability of the shaded area, typically written as a decimal to the nearest thousandth.
It is important to remember that a P-value is a probability, which means that it is a number between [latex]0[/latex] and [latex]1[/latex].
- The smaller the P-value is, the more unlikely it is to observe the sample data given that the null hypothesis is true. Thus, the evidence against the null hypothesis is stronger and is in favor of the alternative hypothesis.
- The larger the P-value is, the more likely it is to observe the sample data. Thus, the evidence against the null hypothesis is weaker.
Important note:
A hypothesis test can be one-sided or two-sided. The example about internet access was a one-sided hypothesis test. The P-value was the area of the right (upper) tail because we want to test if the percentage has increased since 2020.
- If the inequality in the alternative hypothesis is [latex]<[/latex], you have a lower-tailed test.
- If the inequality in the alternative hypothesis is [latex]>[/latex], you have an upper-tailed test.
If the inequality is [latex]≠[/latex], the test is two-sided, or two-tailed. The P-value for a two-tailed test is [latex]2*P(|z|>z^*)[/latex] or double the corresponding one-tailed test.
Let’s calculate our P-value. Use the statistical tool to answer the next question.