- Understand the properties, characteristics, and importance of a normal distribution in statistical analysis.
- Explain how changing the mean and standard deviation will change the characteristics of a normal curve.
Normal Distribution
Normal distribution is one of the most common types of continuous distributions used in statistics. The model we saw about the sodium content in milligrams (mg) of [latex]20[/latex] different cereals is a normal distribution.
normal distribution
A normal distribution is a mathematical model with a smooth bell-shaped curve to describe the bell-shaped data distributions.
A normal distribution has the following characteristics:
- [latex]x[/latex] is a continuous random variable.
- Symmetrical around the mean, [latex]\mu[/latex] (pronounced “mu”), the left side is a mirror image of the right side centered at the mean.
- There is one peak at the mean of bell-shaped distributions.
The following graph displays a normal distribution.
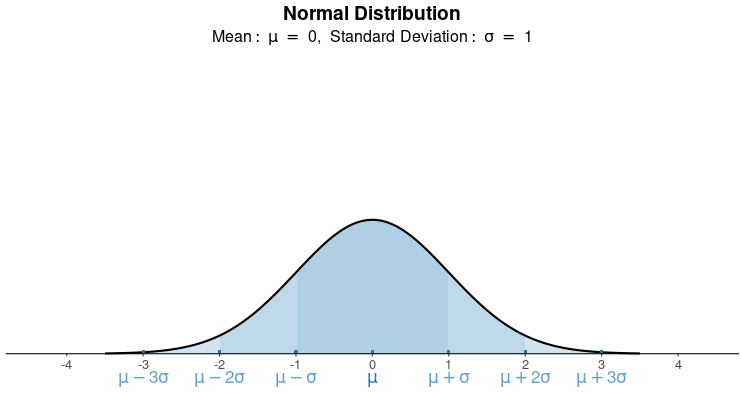
Recall the Empirical Rule we learned earlier. We know that [latex]99.7\%[/latex] of the data fall within three standard deviations of the mean, so for normal distributions, we will be generally concerned with looking at values within [latex]\pm3[/latex] standard deviations ([latex]\sigma[/latex]) of the mean ([latex]\mu[/latex]). If we know that data is normally distributed and we know the mean and standard deviation, we can draw the graph for the normal distribution.
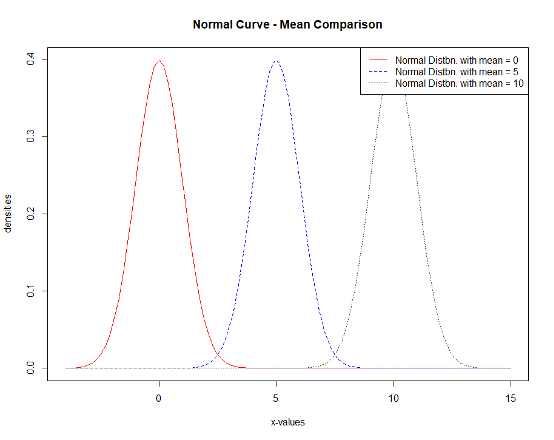
Sometimes the mean is called the “location parameter.”
The value of the mean gives the location of the distribution on the [latex]x[/latex]-axis. Looking at the following graphs, the mean of the red graph (on the left) is [latex]0[/latex], the mean of the blue graph (in the middle) is [latex]5[/latex], and the mean of the green graph (on the right) is [latex]10[/latex]. As the mean increases, the graphs shift to the right on the [latex]x[/latex]-axis.