- Check the conditions for Fisher’s Exact Test
- Explain the relationship of two qualitative binary variables using Fisher’s Exact Test
Remedies for Assumptions Not Met

The International Union for Conservation of Nature’s Red List (IUCN Red List) was established in 1964. Since then, it has evolved to become “the world’s most comprehensive information source on the global extinction risk of animal, fungus, and plant species.”[1]
A researcher is interested in determining whether there is an association between where plants live in the subarctic region and their extinction levels, based on the IUCN classifications. The IUCN Red List consists of nine extinction levels, as presented in the following picture[2]:
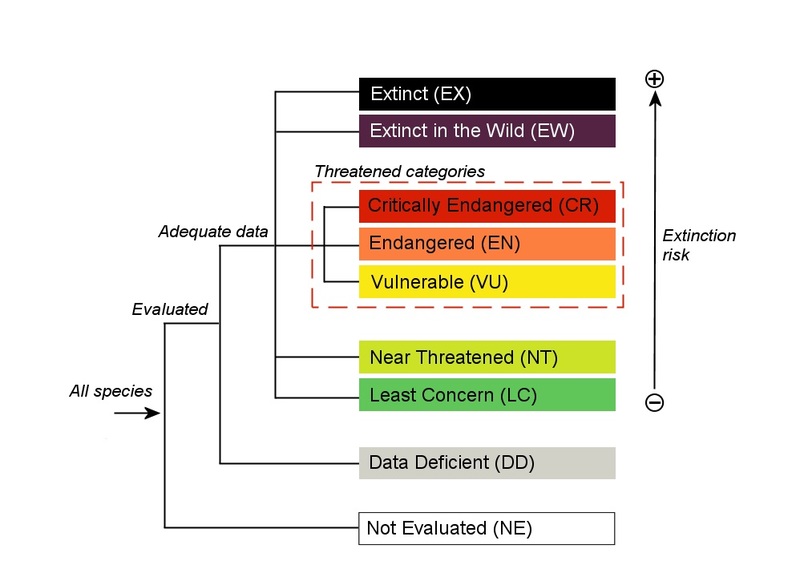
Note that once a species is evaluated and adequate data are available, it may be classified as Least Concern, Near Threatened, Vulnerable, Endangered, Critically Endangered, or Extinct.